
Add an issues (open/closed) panel to a dashboard
Issues are a fundamental part of GitHub repository management, representing bugs, feature requests, and other tasks. Visualizing issue data helps development teams understand workload patterns, identify trends in issue resolution, and monitor project health.
To create a dashboard panel for GitHub issues, complete the following steps:
Sign in to your Grafana Cloud environment, for example
mystack.grafana.net.Click Dashboards in the left navigation menu.
Click New > New Dashboard to create a new dashboard.
Click Add visualization to add your first panel.
In the data source dropdown, select your GitHub data source.
In the query builder:
- Choose Issues from the Query Type dropdown.
- Define the Owner and Repository for which you want to visualize Issues.
For example,
grafana(in both Owner and Repository). - Choose Created At from the Time Field dropdown.
From the Visualization drop-down on the right, select Table.
Configure the panel settings:
- In the Panel options section, enter
GitHub Issues (Open/Closed) Overviewin the Title. - Add additional details in the Description section, explaining what the panel shows.
- In the Panel options section, enter
Use the time picker toggle button in the upper right to select a time range. For example, select Last 30 days to see recent trends.
The following image shows an example of what your panel might look like.
![Example GitHub data source configured successfully in Grafana Cloud]()
Click Save dashboard button on top right to save the panel to your dashboard.
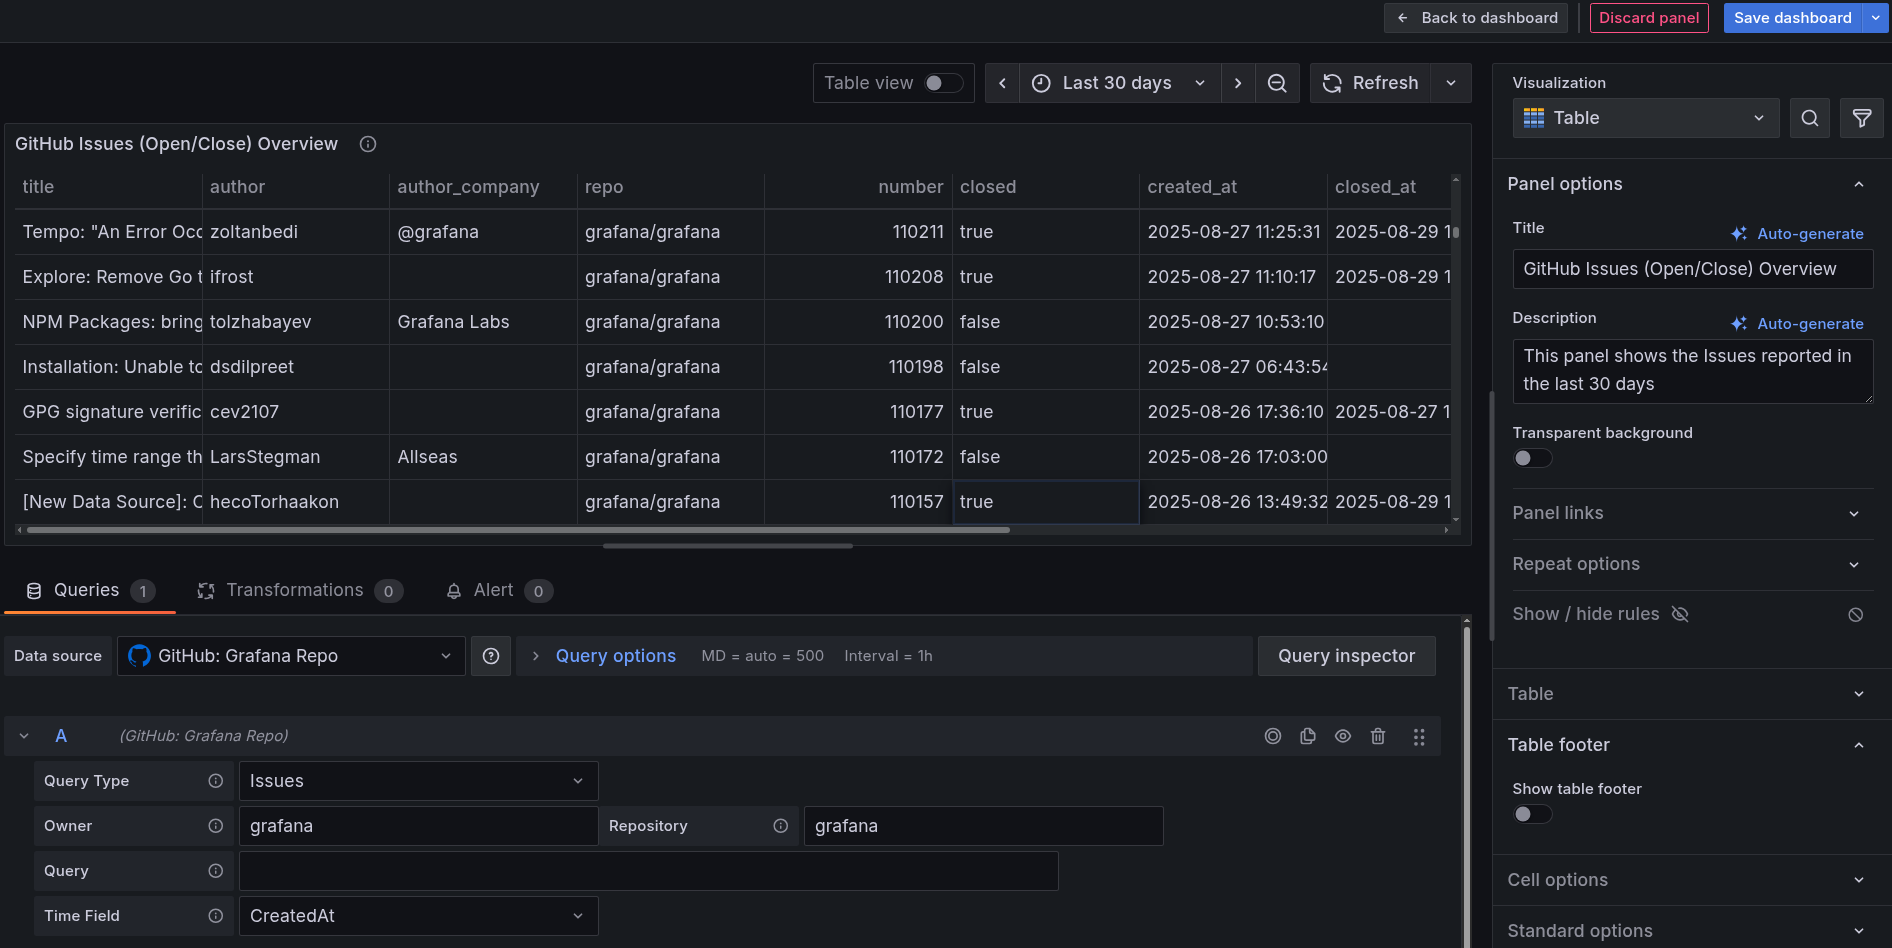
The panel now displays a Table panel visualization showing issue trends over time. You can see both the total number of issues and the number of open and closed issues, helping you understand how issue resolution is progressing.
In the next milestone, you’ll create a similar panel for pull request data.