Open in Grafana Cloud
Complete this learning path directly in your Grafana Cloud stack, or in the Grafana Play stack, with an interactive learning experience.
Visualize GitHub data source in Grafana Cloud
Welcome to the GitHub data source learning journey that shows you how to visualize GitHub repository data in Grafana Cloud.
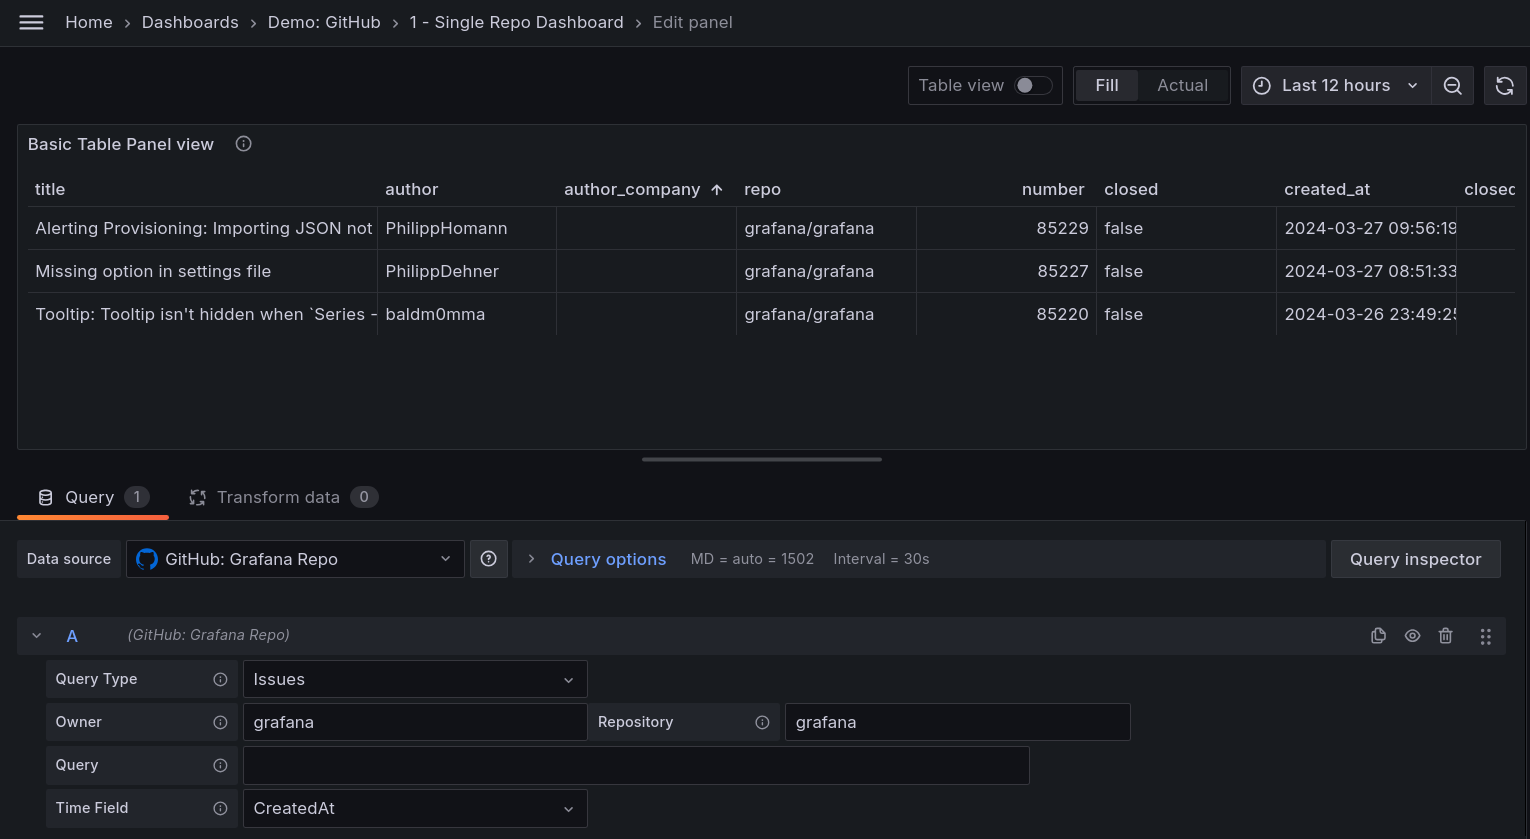
The following image shows an example GitHub dashboard displaying repository metrics:
Here’s what to expect
When you complete this journey, you’ll be able to:
- Understand the value of monitoring GitHub repositories with Grafana Cloud
- Add a GitHub issues panel to a dashboard
- Add a pull request panel to a dashboard
- Add a repository list panel to a dashboard
Before you begin
Before you connect to a GitHub data source, ensure that you have:
- A Grafana Cloud account. To create an account, refer to Grafana Cloud.
- Already completed the Connect to a GitHub data source in Grafana Cloud learning journey.
- Basic familiarity with Grafana navigation and dashboard creation.
Troubleshooting
If you get stuck, we’ve got your back! Where appropriate, troubleshooting information is just a click away.
More to explore
We understand you might want to explore other capabilities not strictly on this path. We’ll provide you opportunities where it makes sense.