
Open in Grafana Cloud
Complete this learning path directly in your Grafana Cloud stack, or in the Grafana Play stack, with an interactive learning experience.
Connect to a GitHub data source in Grafana Cloud
The GitHub data source connects to the GitHub API to retrieve repository data, enabling you to create dashboards that display repository metrics such as issue tracking, pull request analytics, releases, tags, and so on, directly within Grafana.
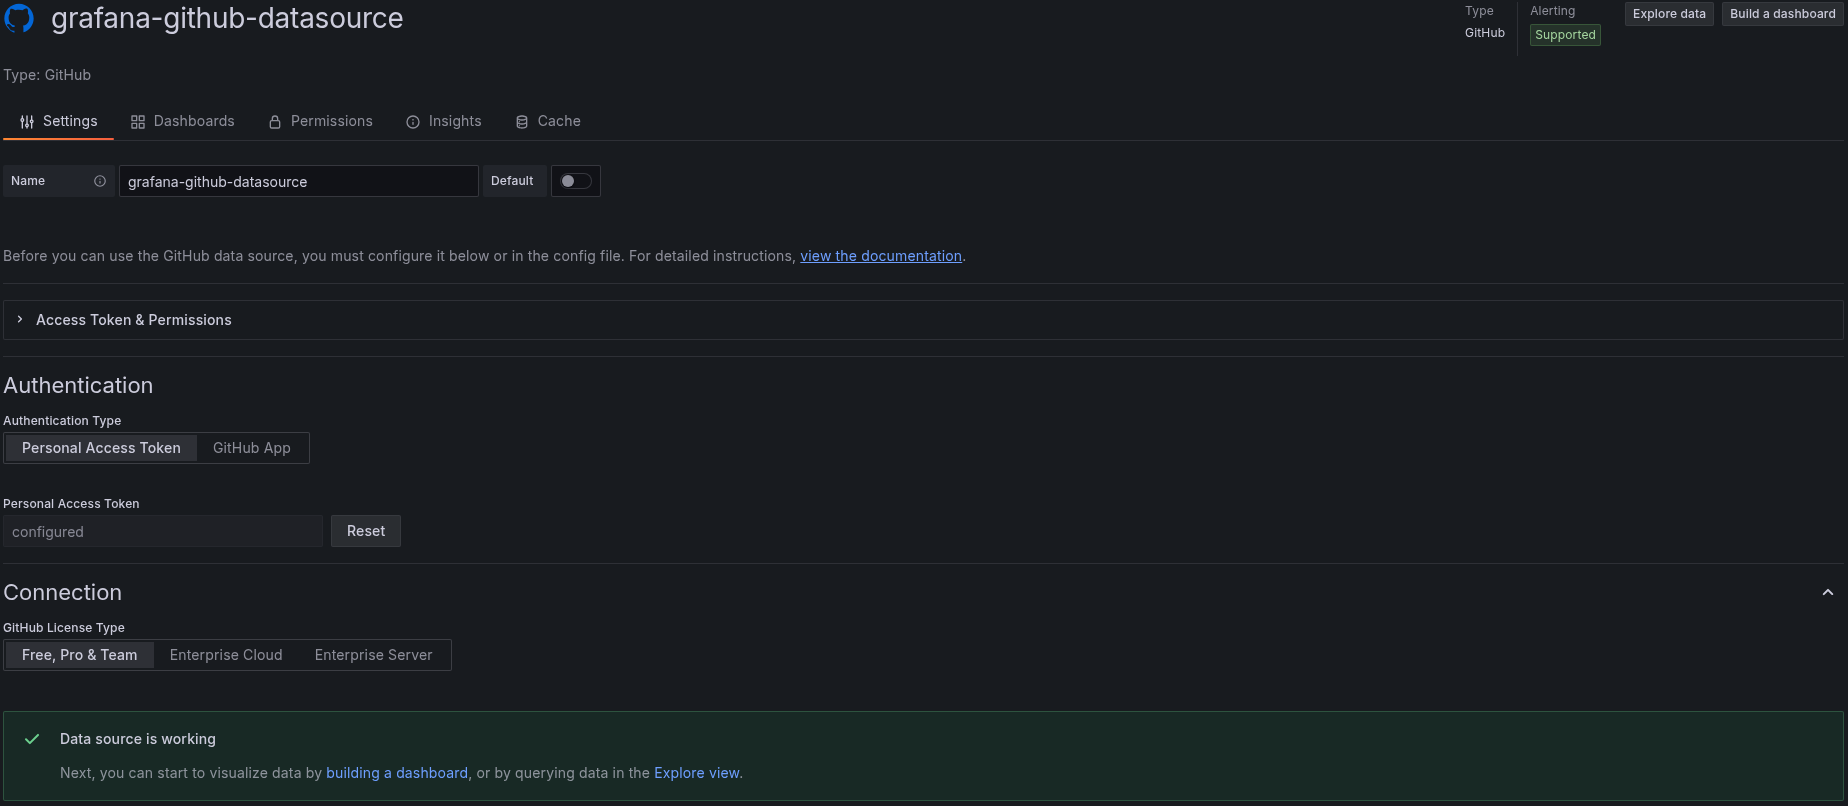
The following image shows an example GitHub data source configured successfully:
Here’s what to expect
When you complete this journey, you’ll be able to:
- Understand the value of monitoring GitHub repositories through observability
- Learn the advantages of using the GitHub data source
- Create a personal access token for GitHub API access
- Install and configure the GitHub data source in Grafana Cloud
Before you begin
Before you connect to a GitHub data source, ensure that you have:
- A Grafana Cloud account. To create an account, refer to Grafana Cloud.
- A GitHub account (free or Enterprise) with access to repositories you want to monitor.
- Administrative permissions in your Grafana Cloud instance to install data source.
- Basic familiarity with Grafana navigation and dashboard creation.
Troubleshooting
If you get stuck, we’ve got your back! Where appropriate, troubleshooting information is just a click away.
More to explore
We understand you might want to explore other capabilities not strictly on this path. We’ll provide you opportunities where it makes sense.