
Open in Grafana Cloud
Complete this learning path directly in your Grafana Cloud stack, or in the Grafana Play stack, with an interactive learning experience.
Explore Elasticsearch logs using Grafana
Welcome to the Explore Elasticsearch logs using Grafana learning journey. Traditional log analysis often requires switching between multiple tools or writing complex queries to find the information you need. This fragmented approach slows down troubleshooting and makes it harder to correlate events across your systems.
Grafana provides a unified interface to search, filter, and analyze Elasticsearch logs alongside your metrics and traces. By bringing all your observability data into a single platform, you can identify issues faster and perform root cause analysis more effectively.
Elasticsearch is a search and analytics engine commonly used for log aggregation and analysis. Grafana’s built-in Elasticsearch data source enables you to query logs using Lucene syntax, visualize log patterns over time, and correlate log events with other telemetry data.
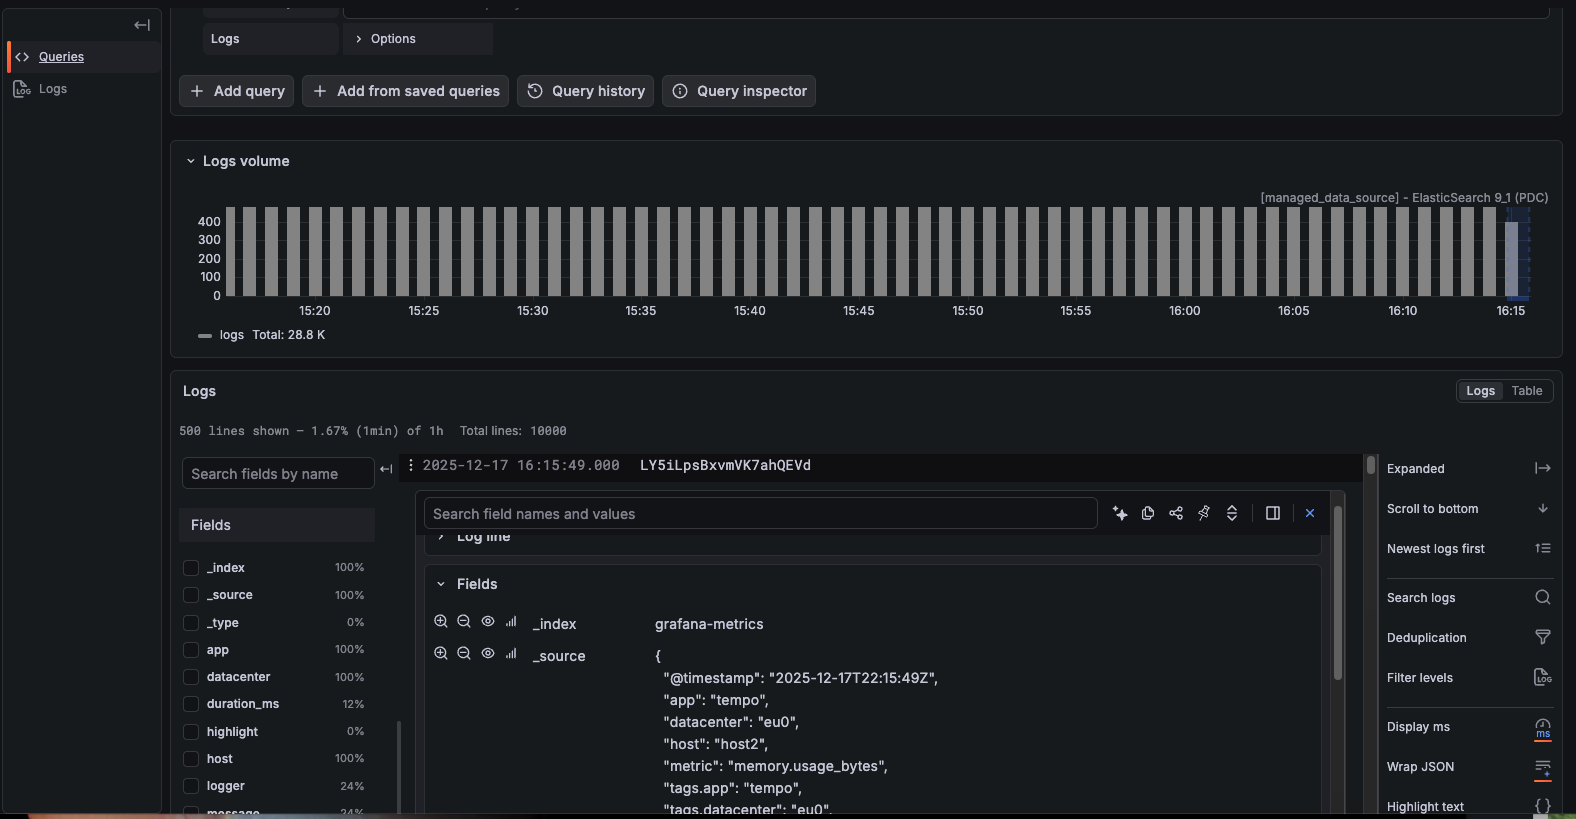
The image below shows Elasticsearch logs displayed in Grafana’s Explore interface with color-coded log levels.
Here’s what to expect
When you complete this journey, you’ll be able to:
- Understand the value of exploring Elasticsearch logs in Grafana
- Navigate to the Explore interface and select your Elasticsearch data source
- Use the Logs query type to analyze log data
- Write Lucene queries to search and filter specific log entries
- Configure log display options for proper message and level field mapping
- Filter logs by time range for focused investigation
- Add log queries to dashboards for ongoing monitoring
Troubleshooting
If you get stuck, we’ve got your back! Where appropriate, troubleshooting information is just a click away.
More to explore
We understand you might want to explore other capabilities not strictly on this path. We’ll provide you opportunities where it makes sense.
Before you begin
Before you explore Elasticsearch logs in Grafana, ensure that you have:
- A Grafana Cloud account. To create an account, refer to Grafana Cloud.
- An Elasticsearch data source configured in Grafana. To add the data source, refer to Configure the Elasticsearch data source.
- Logs ingested into your Elasticsearch cluster with a configured index pattern.
- Basic familiarity with your Elasticsearch index structure and the fields used for log messages and levels.