
Open a metric visualization in Explore
Explore is your starting point for querying and analyzing data in Grafana. It lets you run queries, visualize results, and build understanding of your data before creating dashboards.
To open a metric visualization in Explore, complete the following steps:
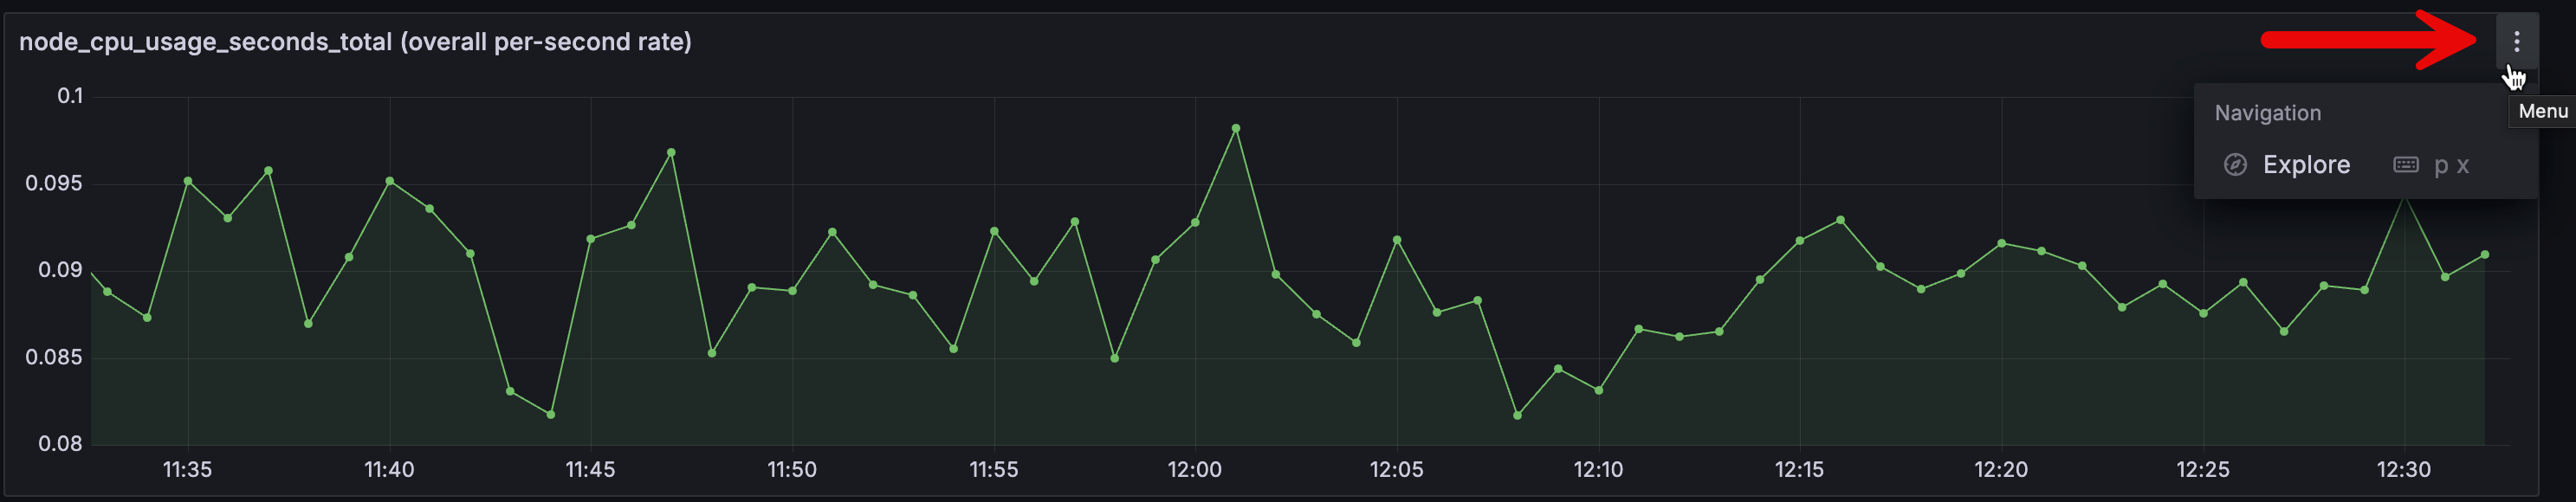
- Hover your cursor over the metric you want to open in Explore.
- Click the Menu icon, then click Explore.
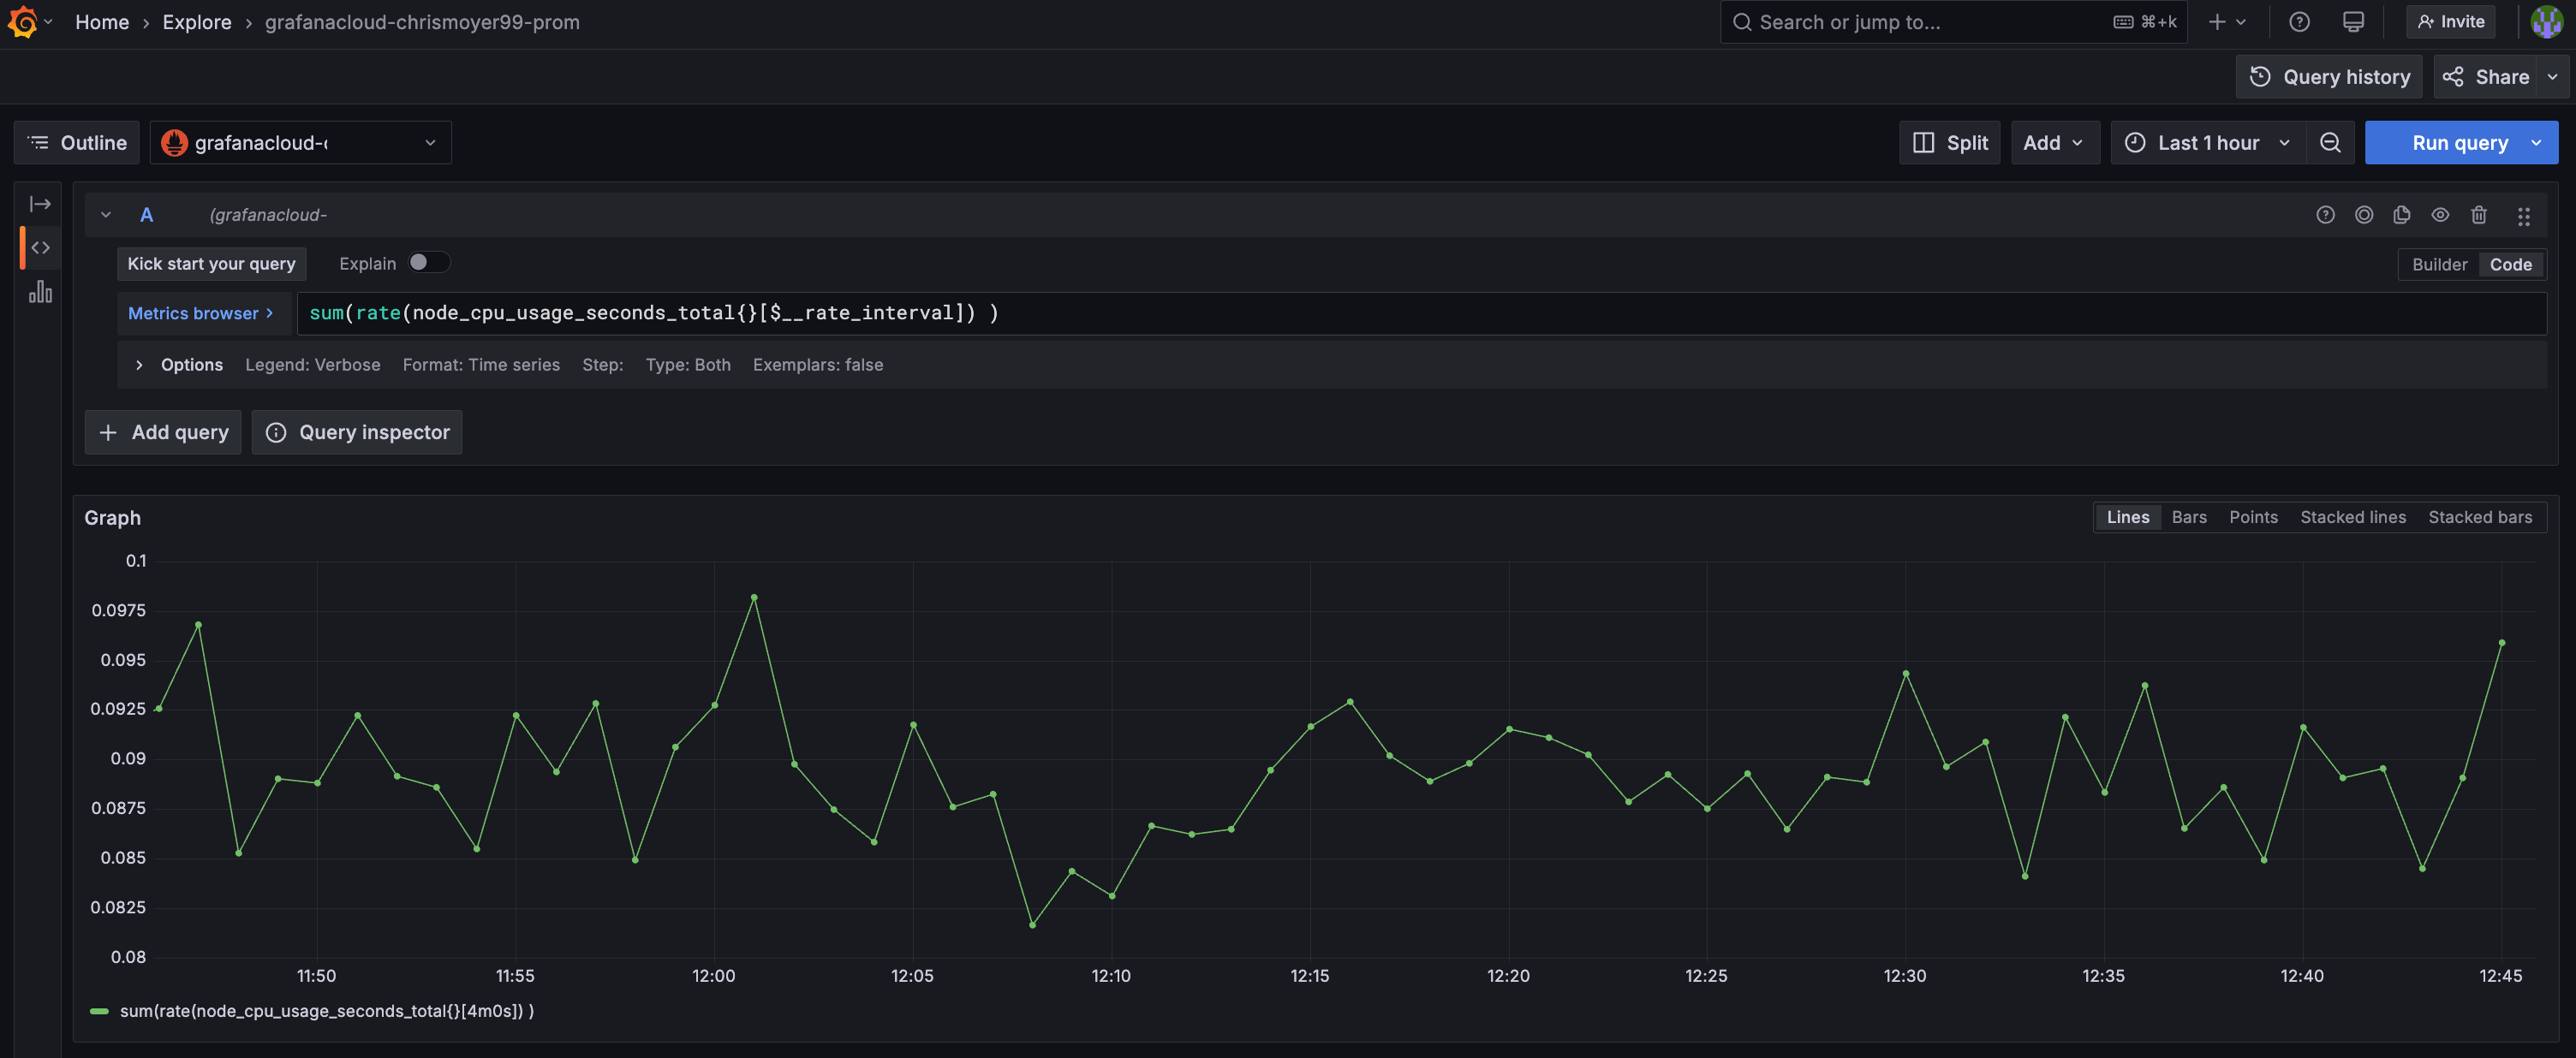
- When the metrics visualization opens, you’ll see the query view. If needed, you can edit the query.
In your final milestone, you’ll learn how to add the visualization to a dashboard.
More to explore (optional)
At this point in your journey, you can explore the following paths:
page 5 of 7