Open a log visualization in Explore
Explore is your gateway for querying, analyzing, and aggregating data in Grafana. It allows you to visually explore and iterate until you develop a working query or set of queries for building visualizations and conducting data analysis. If your data source supports graph and table data, there’s no need to create a dashboard, as Explore can display the results in both formats. This facilitates quick, detailed, real-time data analysis.
With Explore you can:
- Create visualizations to integrate into your dashboards.
- Create queries using mixed data sources.
- Create multiple queries within a single interface.
- Understand the shape of your data across various data sources.
- Perform real time data exploration and analysis.
Key features include:
- Query editor, based on specific data source, to create and iterate queries.
- Query history to track and maintain your queries.
- Query inspector to help troubleshoot query performance.
To open a log visualization in Explore, complete the following steps:
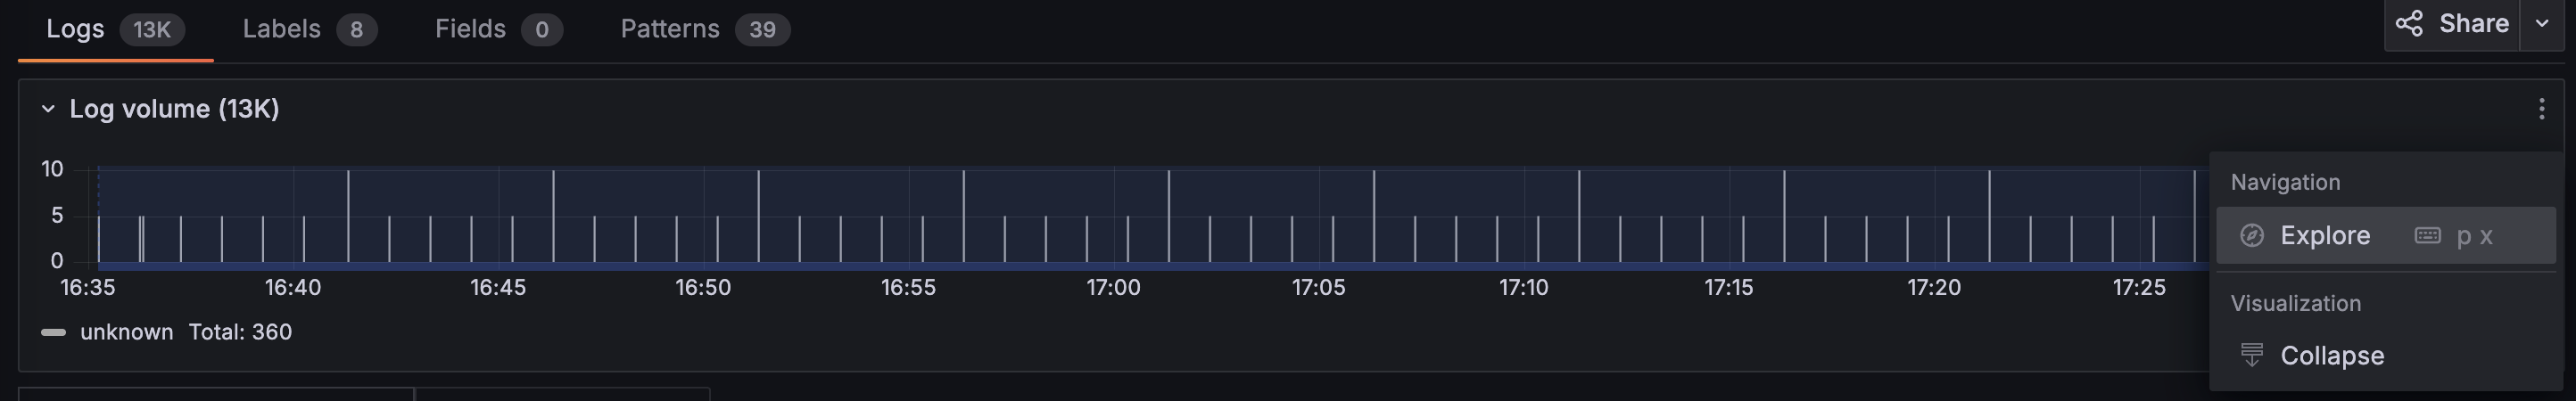
Hover your cursor over the log you want to open in Explore.
![Image shows navigating to Explore]()
Click the Menu icon.
Click Explore.
When the Explore page opens, you’ll see the query view. If needed, you can edit the query.
![Image shows log metric open in Explore]()
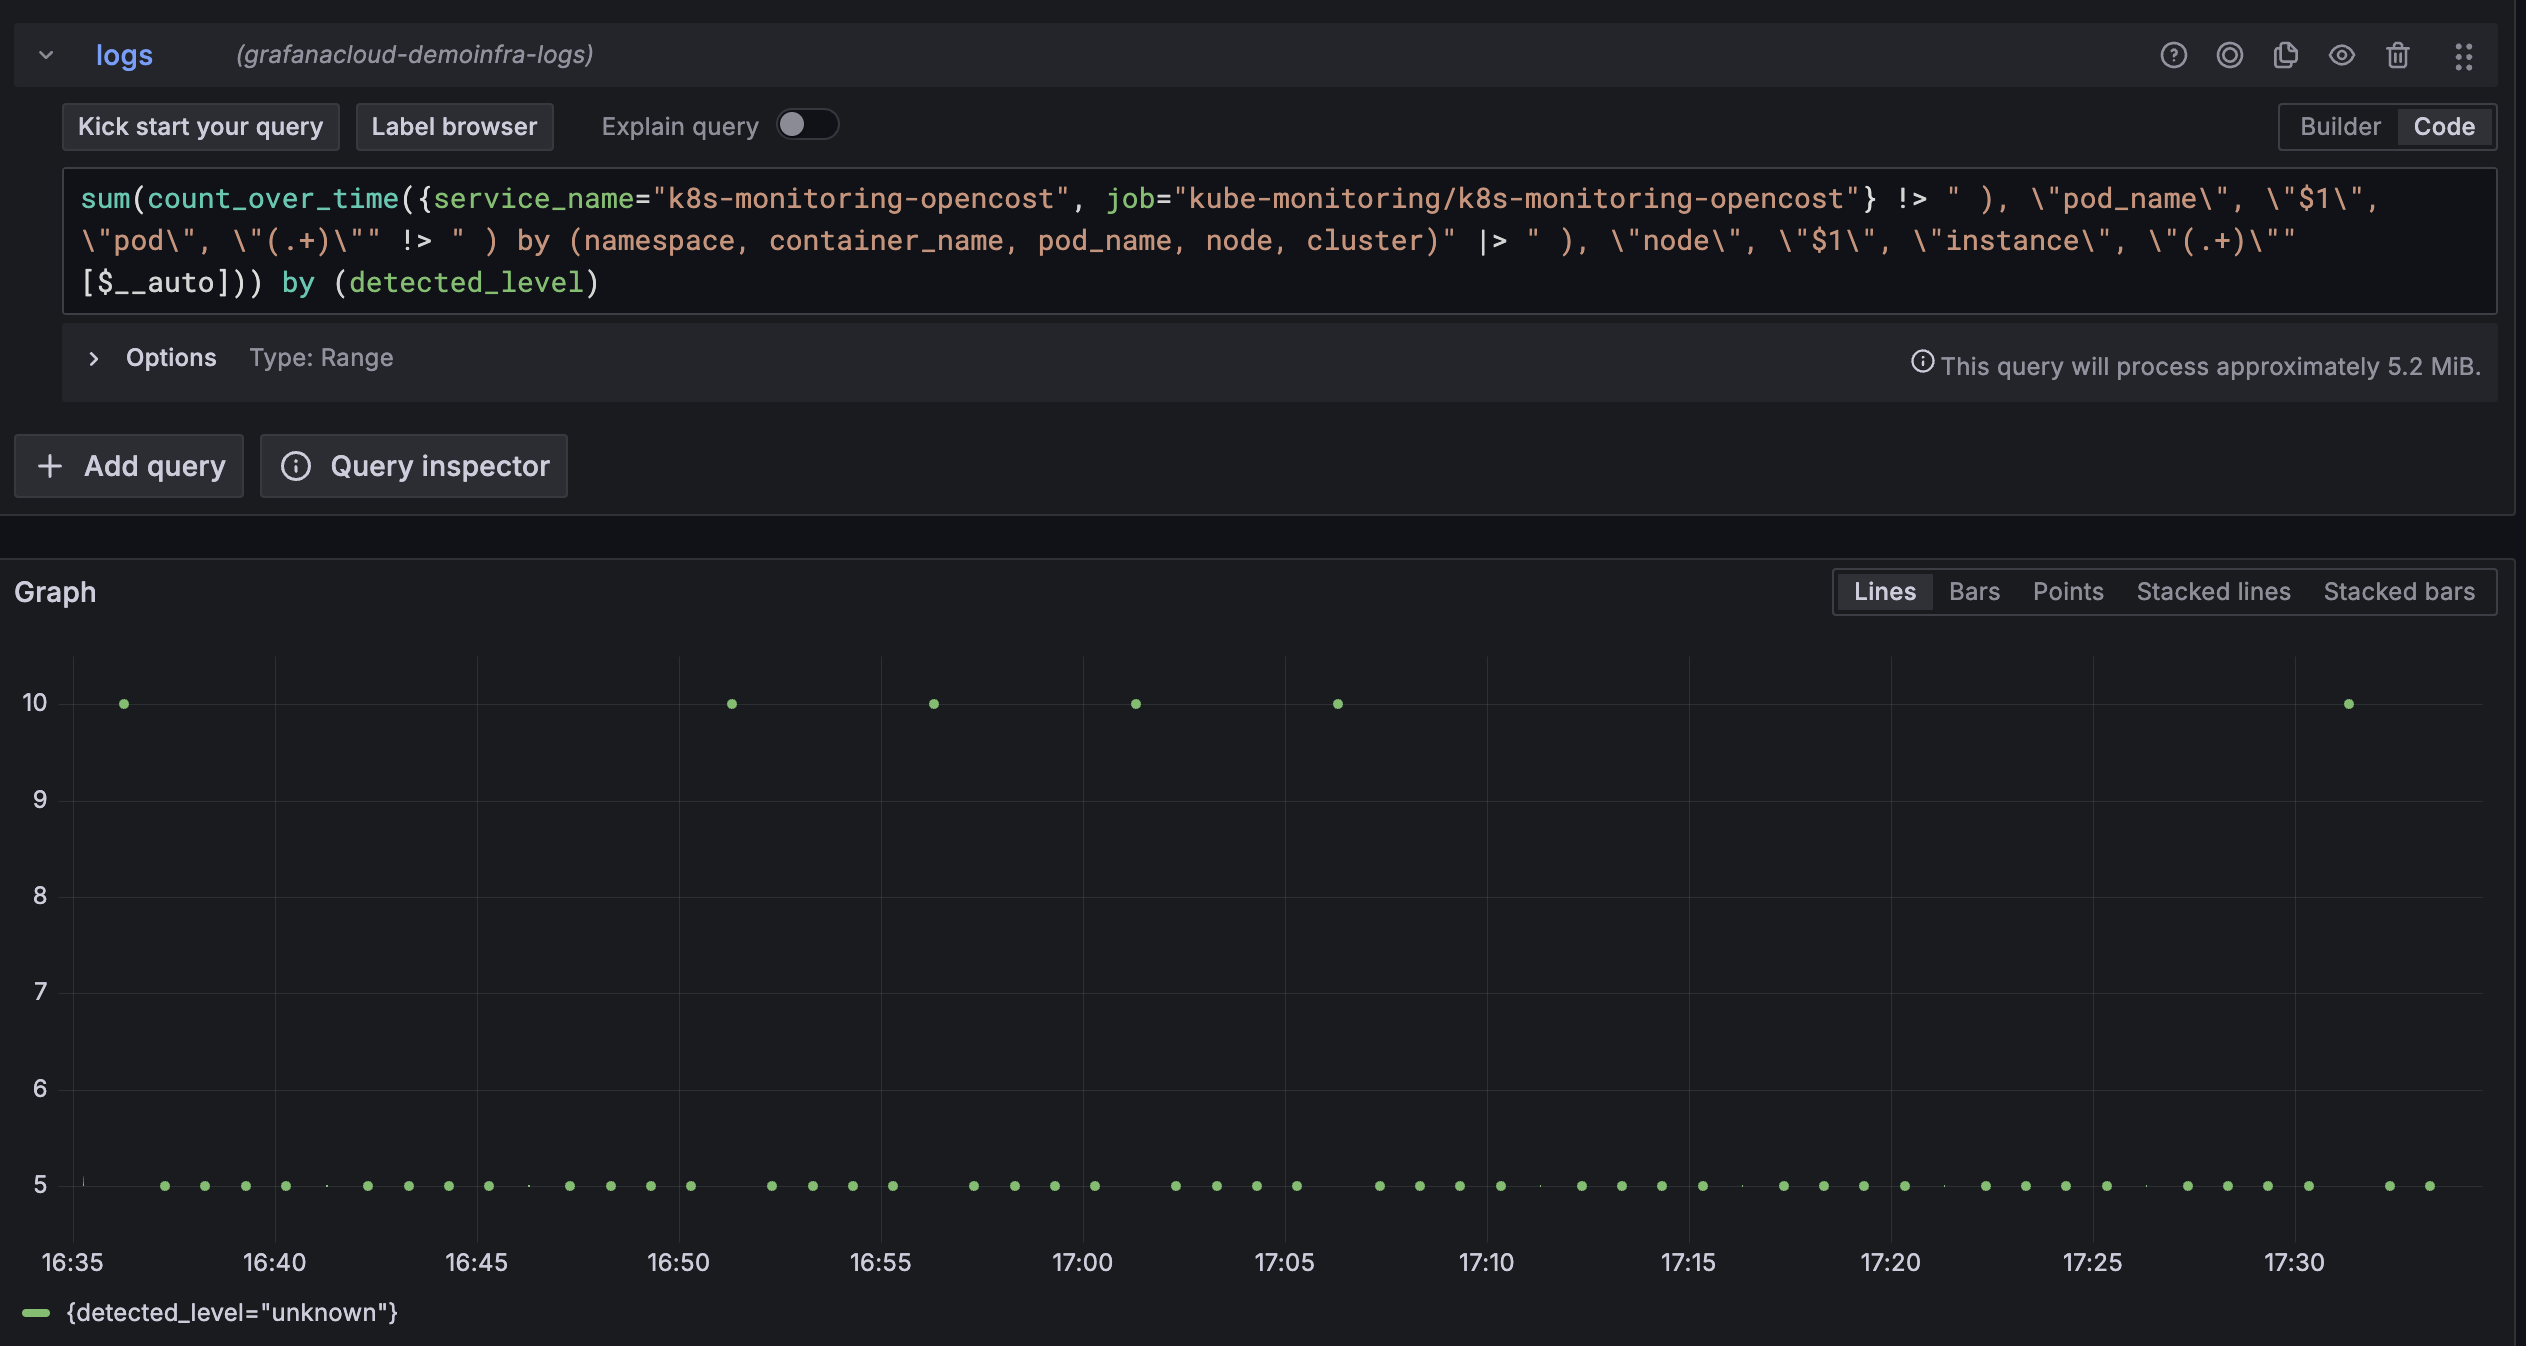
To better understand the query, click the Explain query toggle.
In your final milestone, you’ll learn how to add the visualization to a dashboard.
At this point in your journey, you can explore the following paths:


