Filtering logs with labels and fields
You can analyze and investigate the data and spot log trends and patterns. Reviewing related logs also provides a broader understanding of what’s happening in your application.
You use Labels and Fields to filter logs. Labels are key-value pairs attached to each log line when it’s ingested into Loki. Fields are key-value pairs parsed from the log line and useful for filtering logs in finer detail.
To filter the logs with labels and fields, perform the following steps:
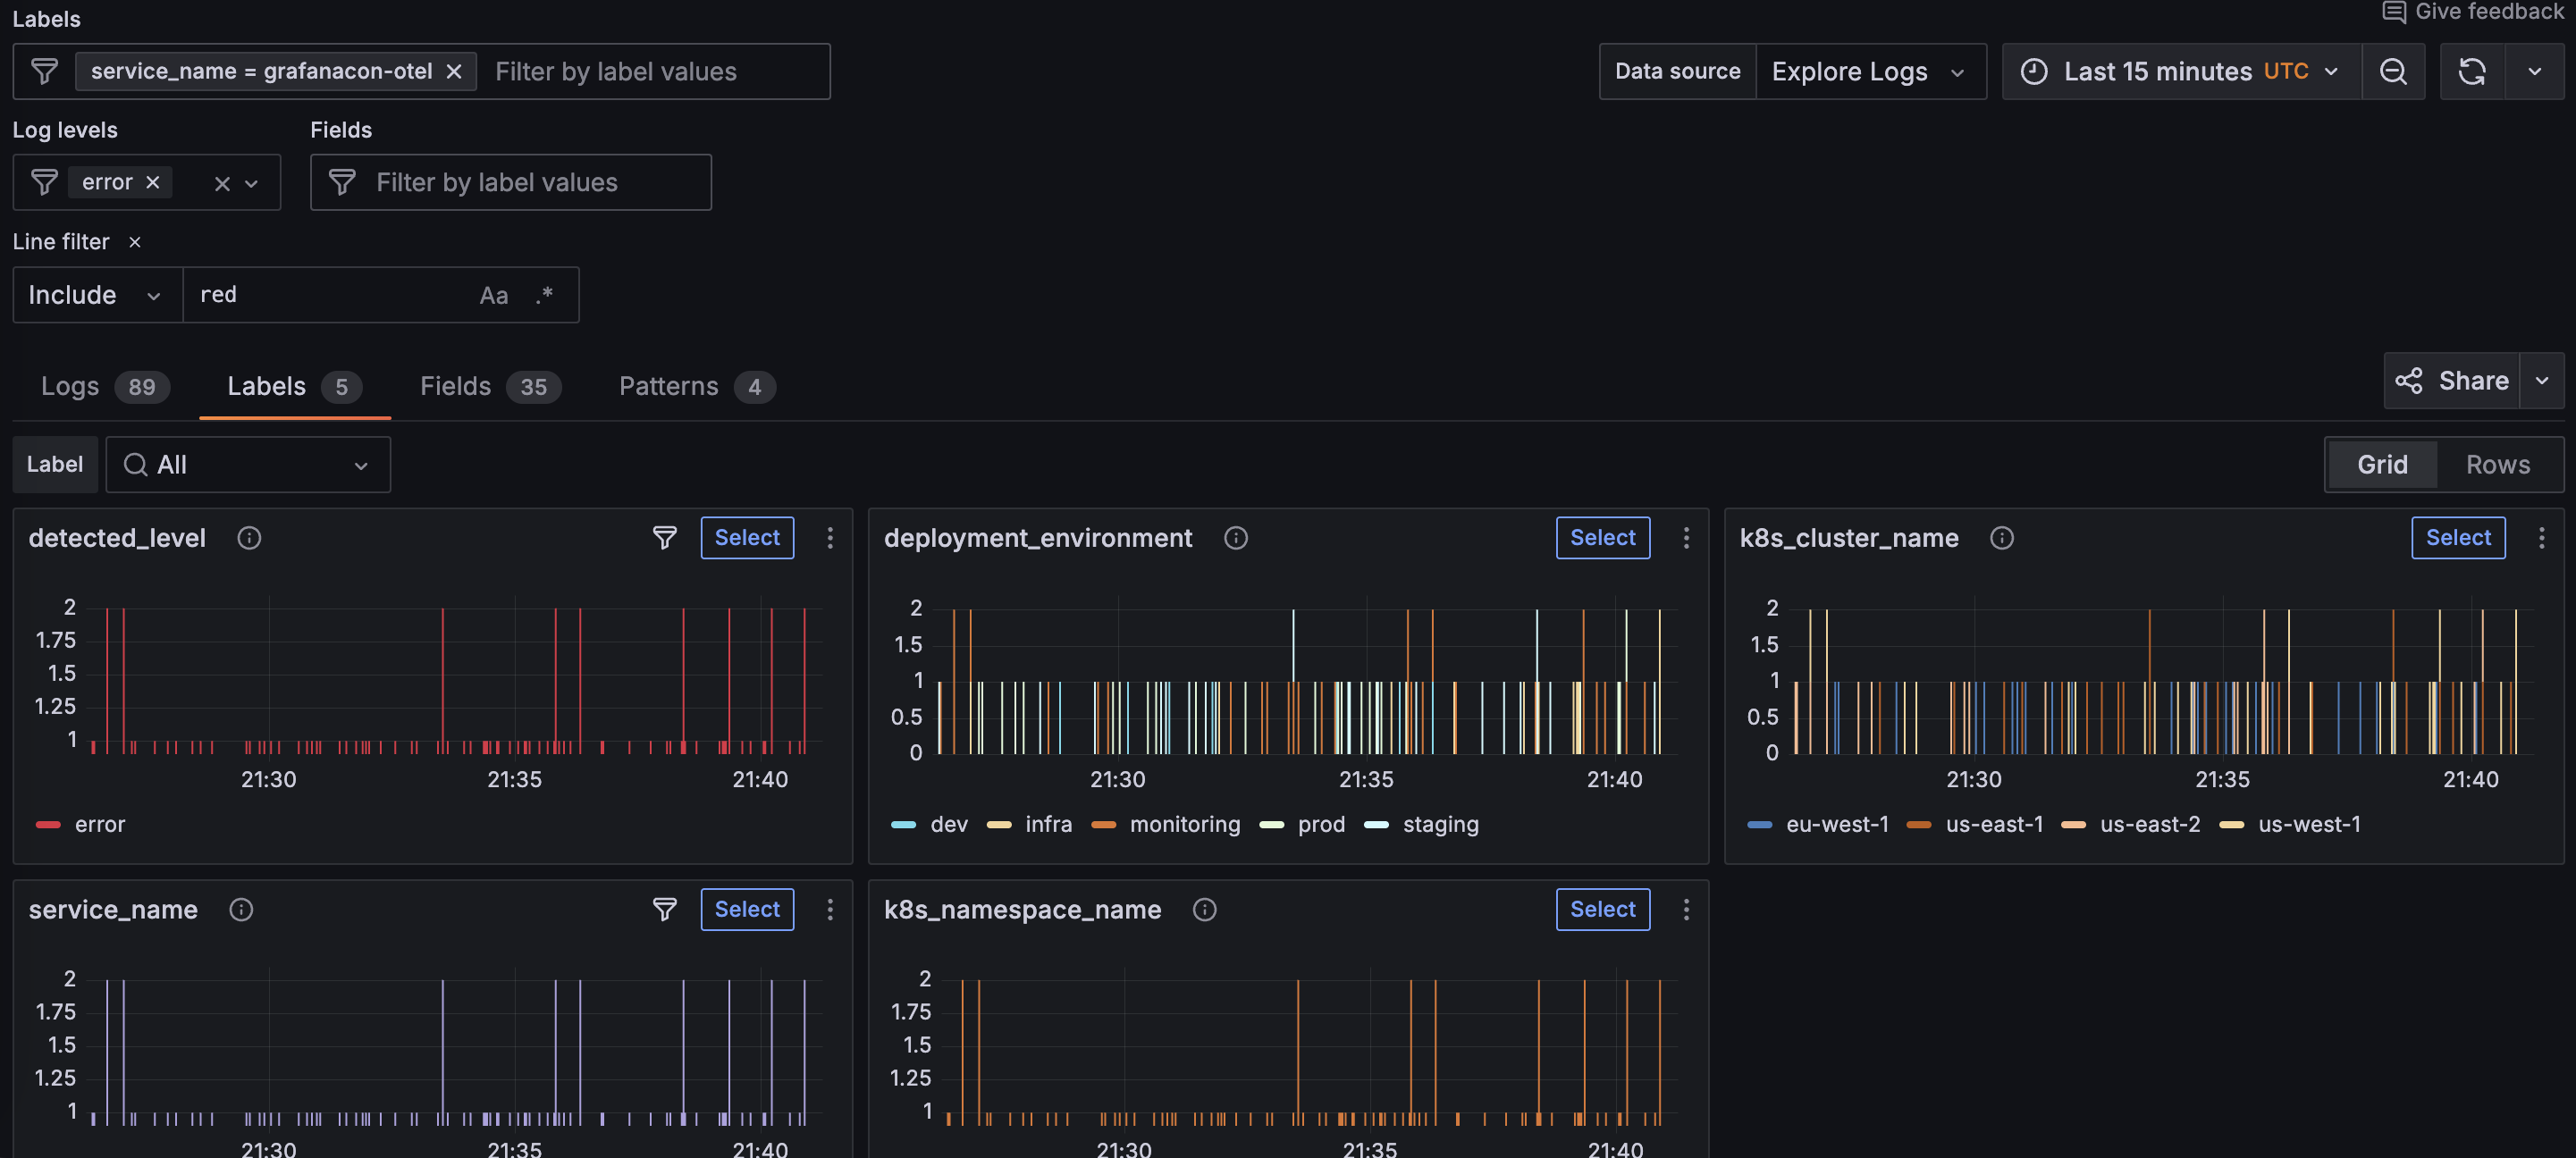
Click the Labels tab to show log visualizations for the labels attached to your log lines.
The following example shows all the available labels for a service.
Look for an interesting label and click the Select button to view the log visualization for that label.
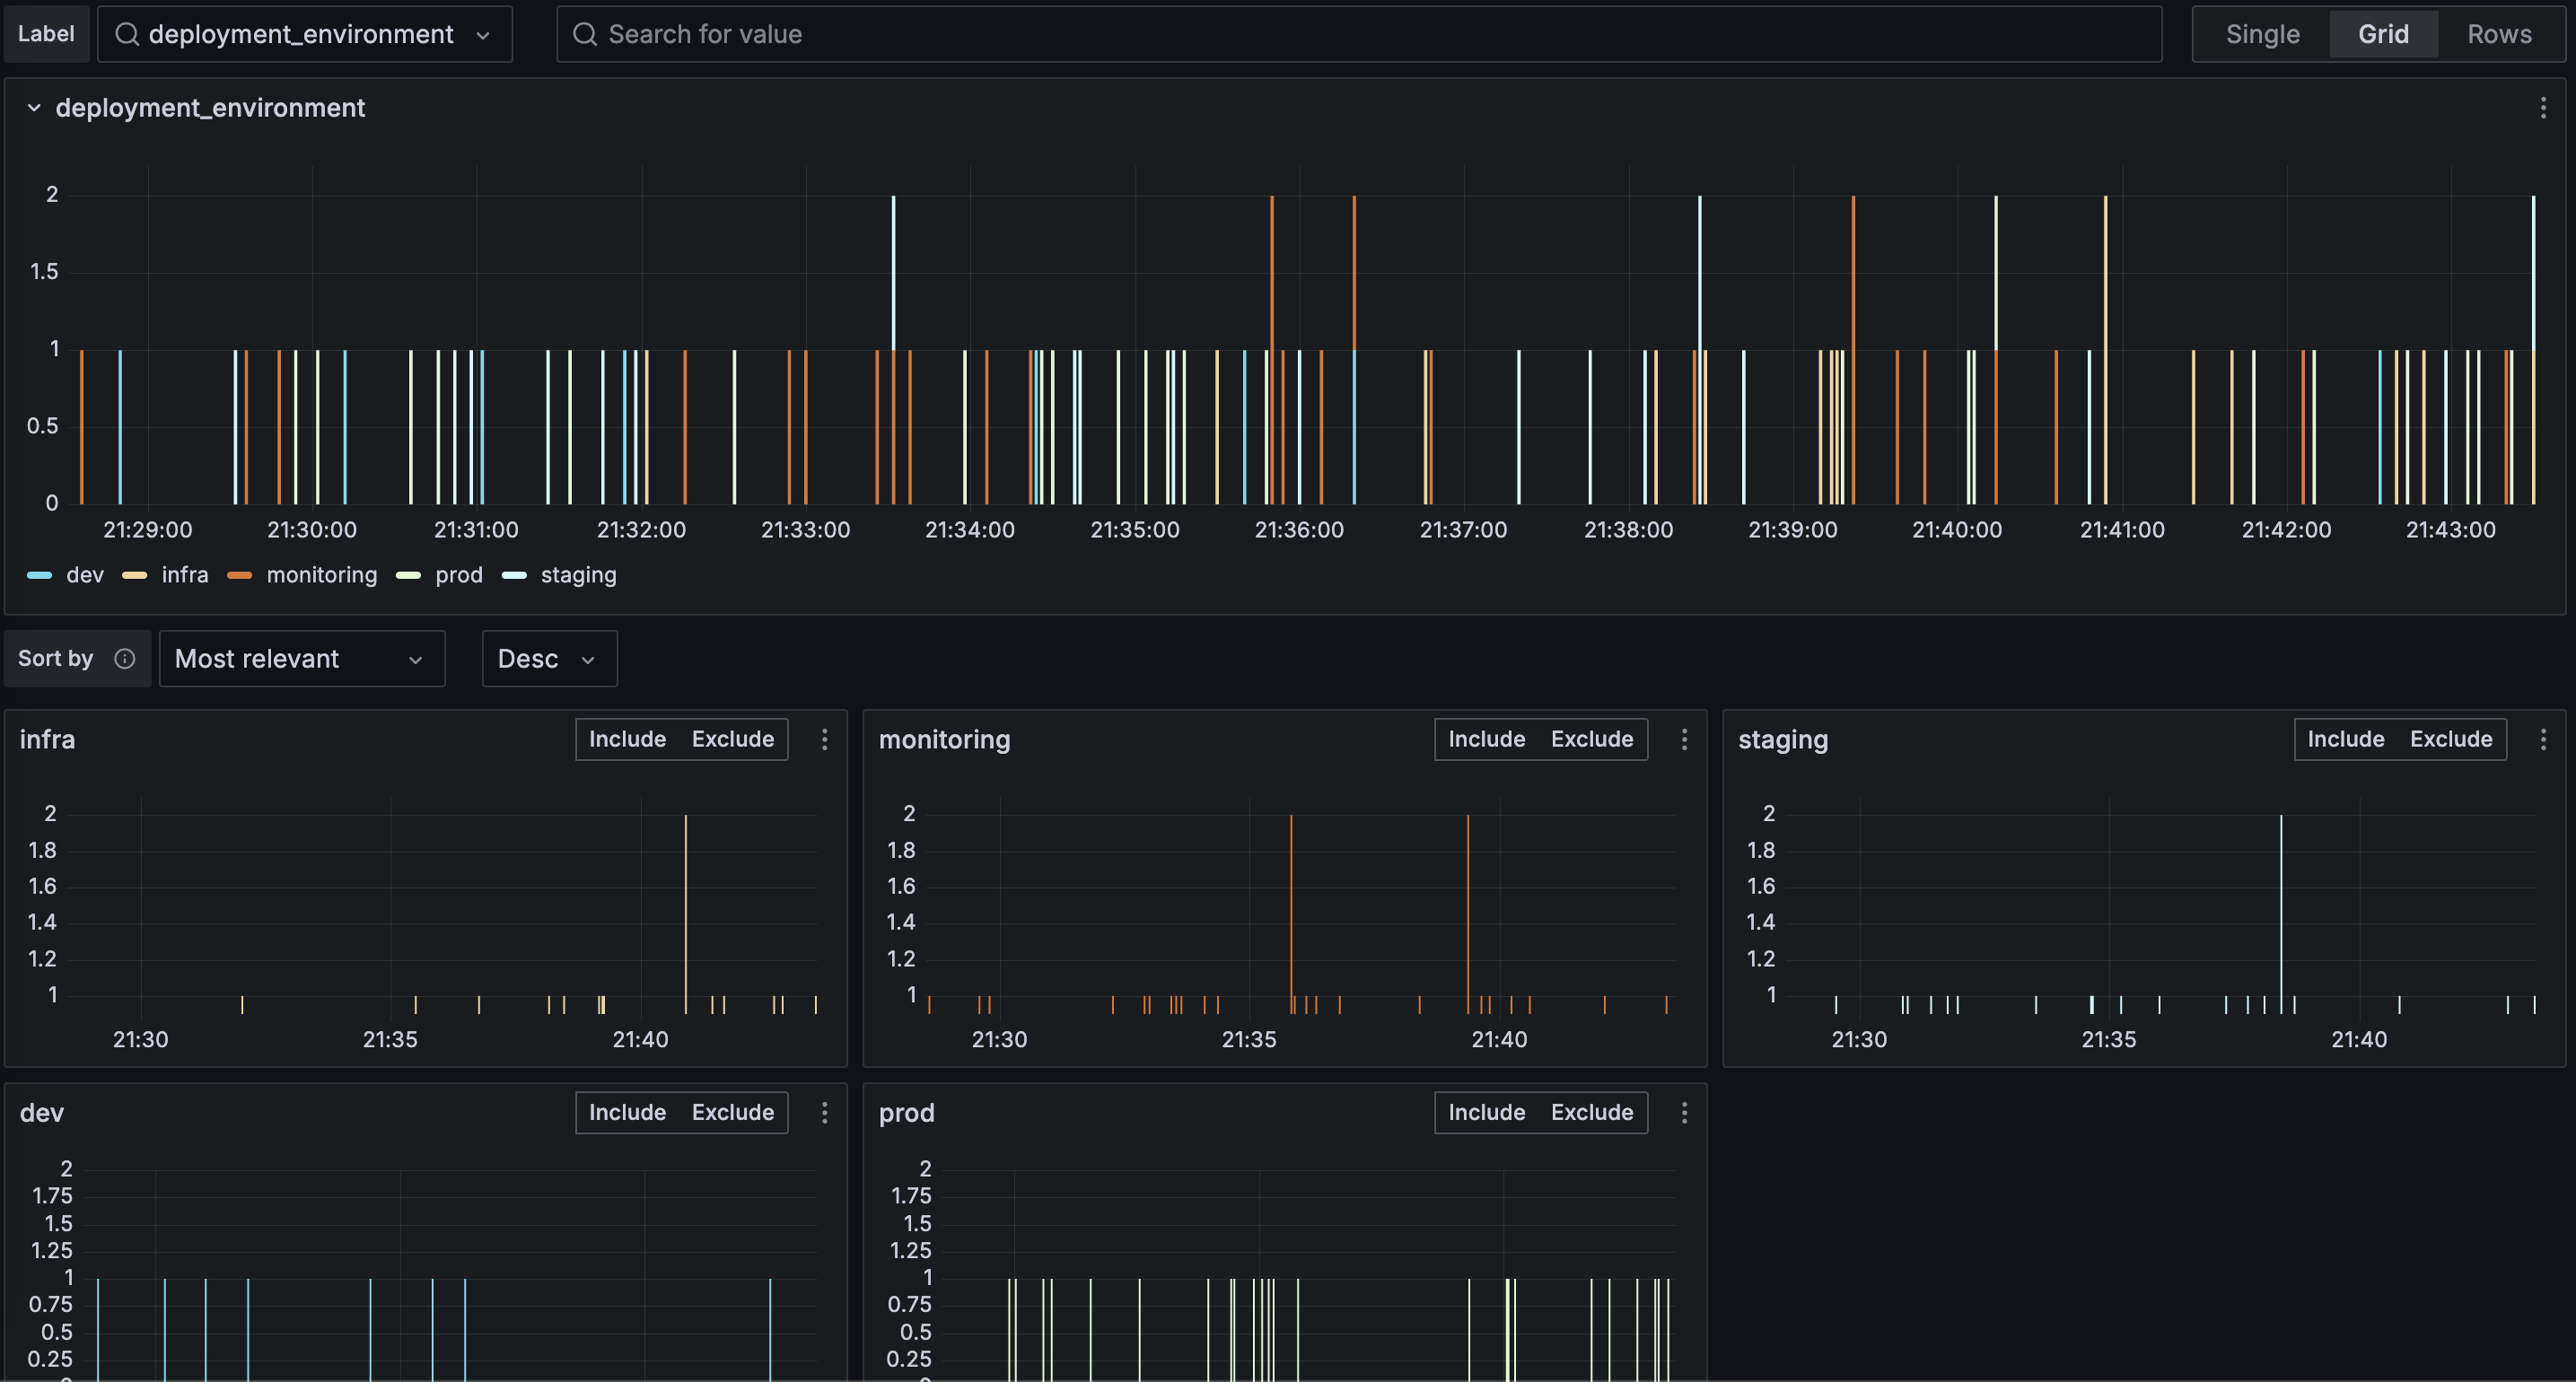
Using the error example from the previous milestone, the
deployment_environmentlabel is selected, which shows the error breakdown by environment.To include logs for a specific label value, find the value you want and click Include.
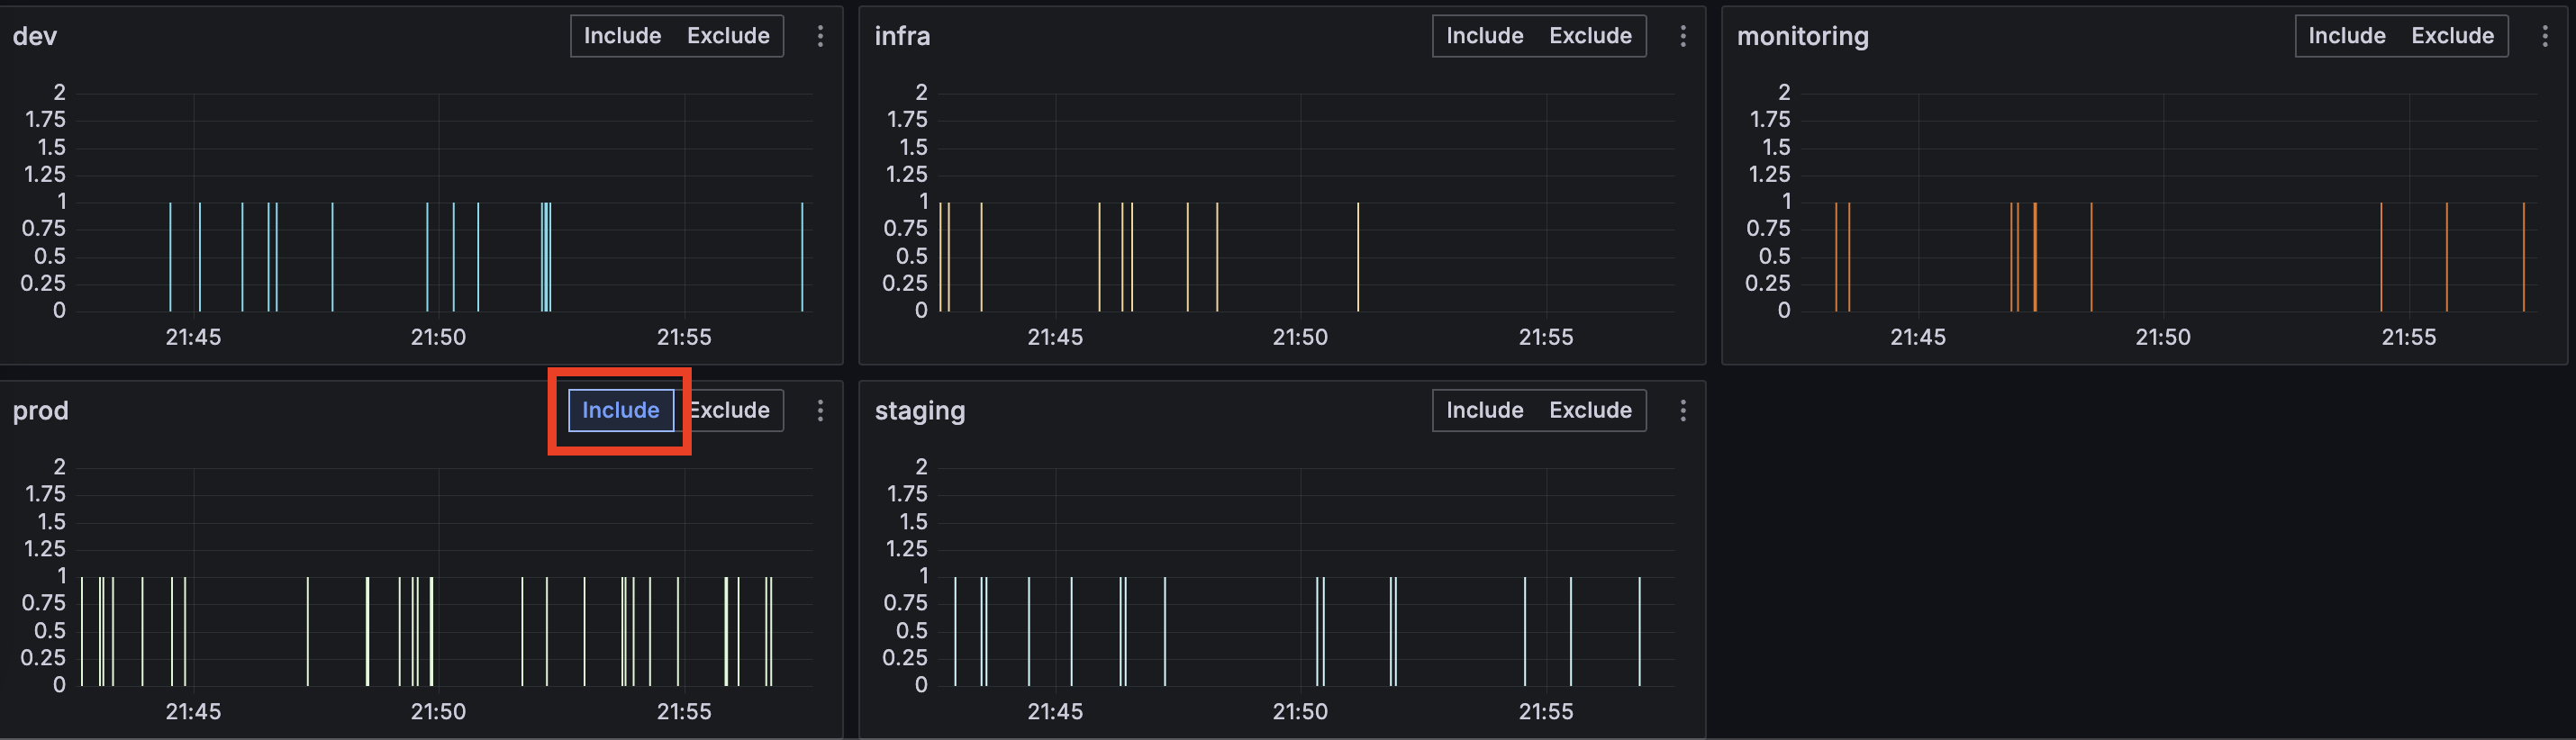
Using the error example from the previous milestone, the
prodvalue is the only value included.Repeat the process for the Fields tab to further refine your filters.
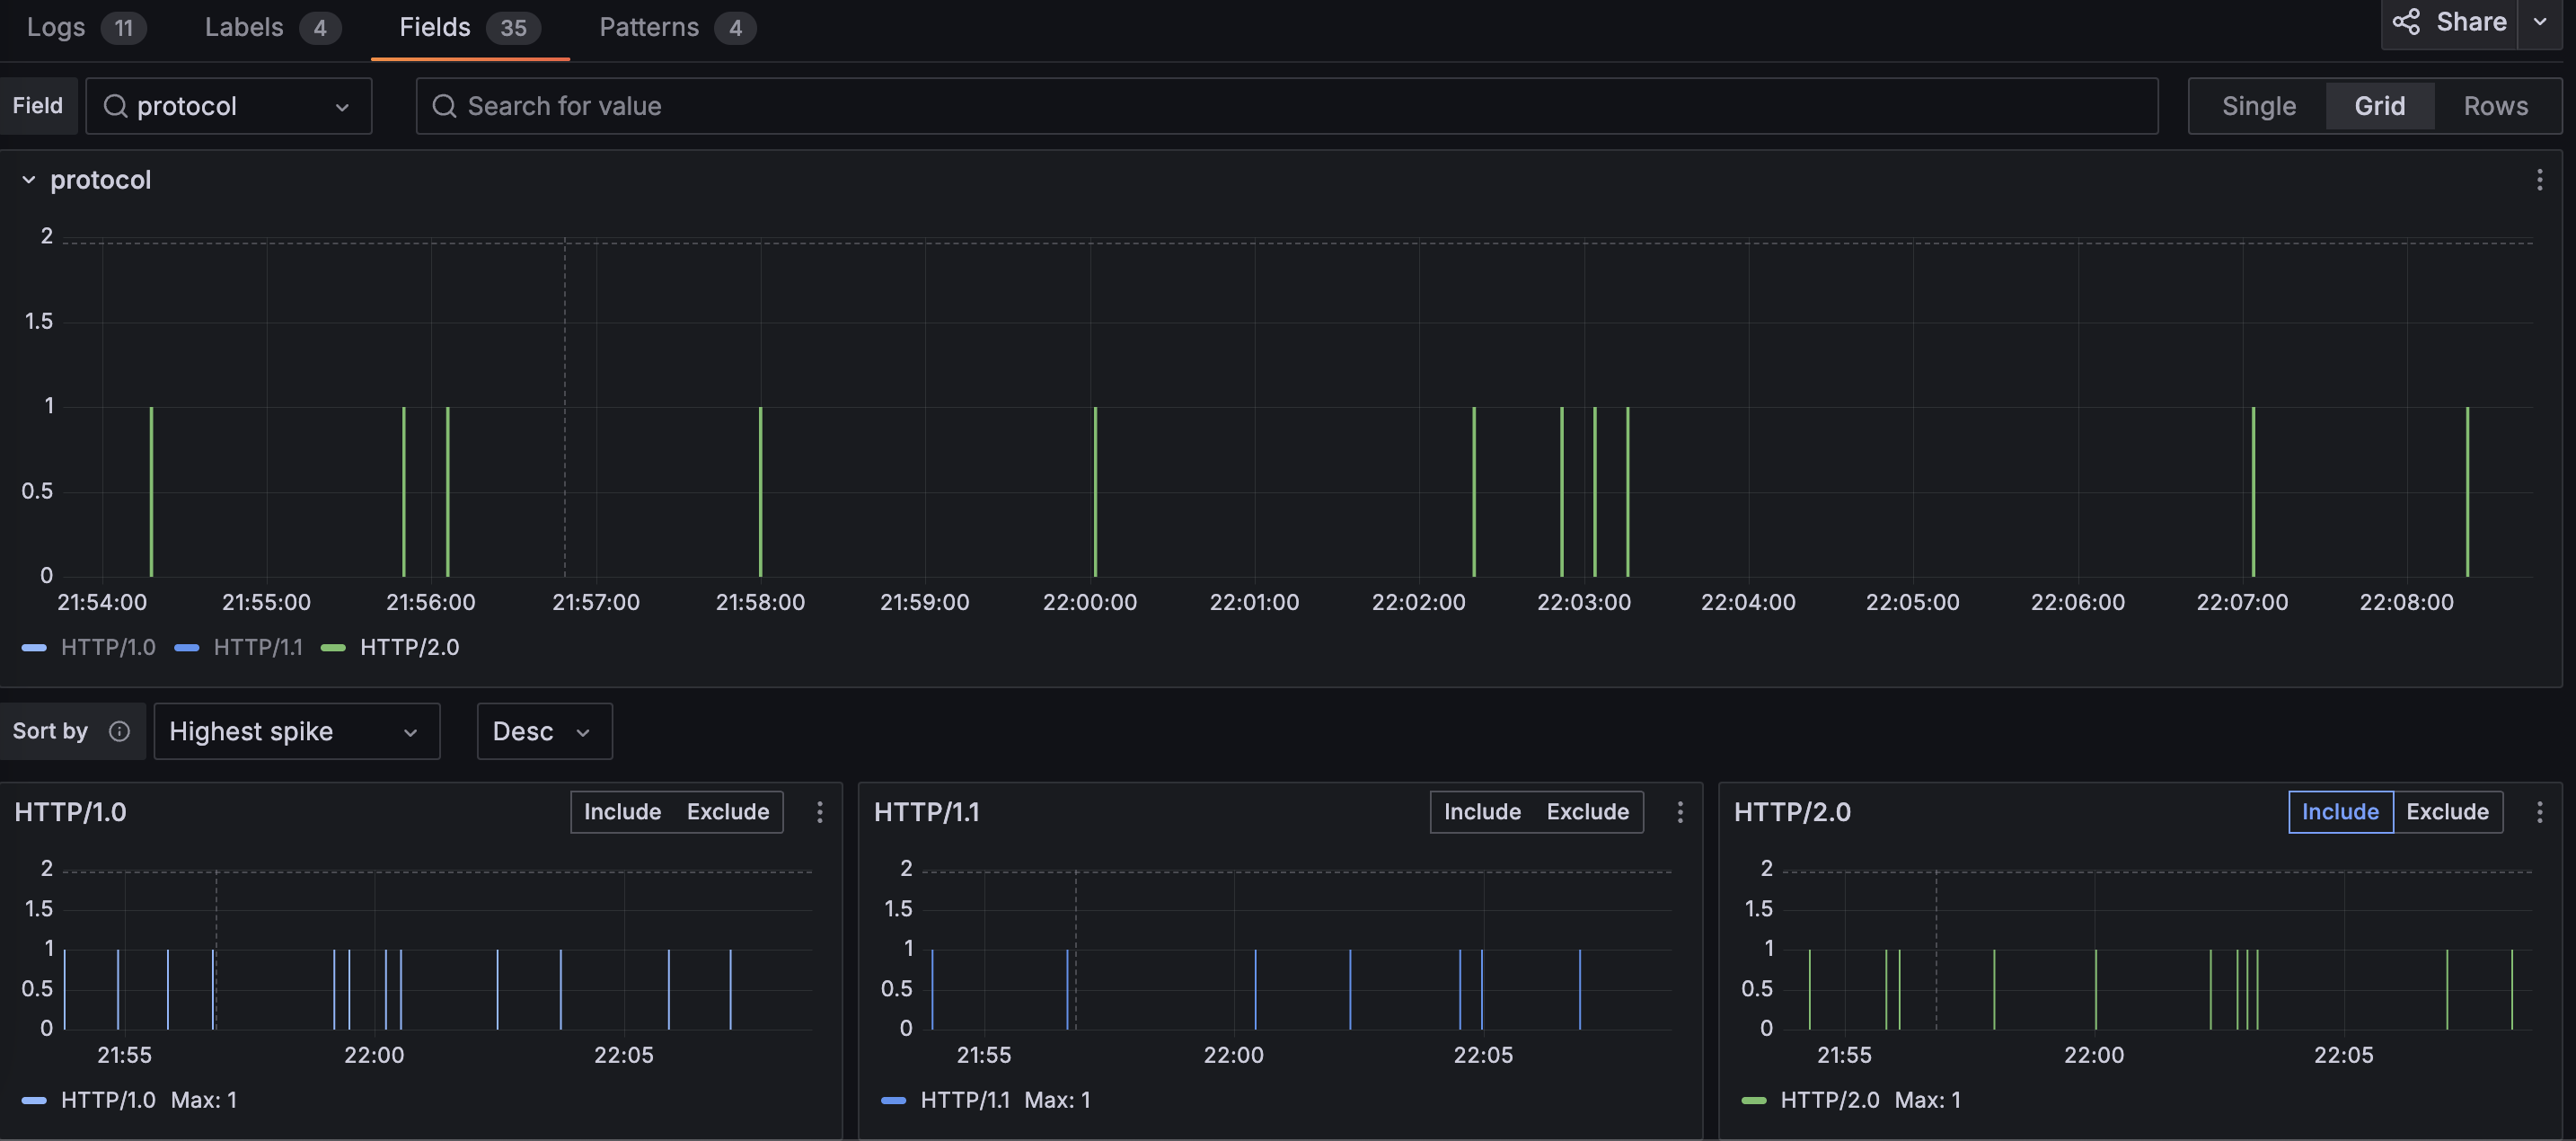
In the following example, the
protocolfield is selected, and only theHTTP/2.0value is included.Click the Logs tab again and investigate the log volumes and log entries related to the filters you set.
Using the same error example, you should only see error logs specific to production where the protocol is
HTTP/2.0.
In the next milestone, you’ll learn how to use log patterns to spot spikes or other changes in your application.
More to explore (optional)
Troubleshooting
Explore the following troubleshooting topics if you need help:
Please tell us what didn't work: