
Select probe locations
Probe locations are the global locations from which Synthetic Monitoring runs your checks. Grafana Labs operates public probes in data centers around the world, enabling you to test your services from multiple geographic regions simultaneously.
Selecting multiple probe locations helps you understand availability and performance from where your users are located. If your service is accessible from some locations but not others, using multiple probes helps you identify region-specific issues such as DNS problems, network routing failures, or CDN misconfigurations.
To select probe locations and create your check, complete the following steps:
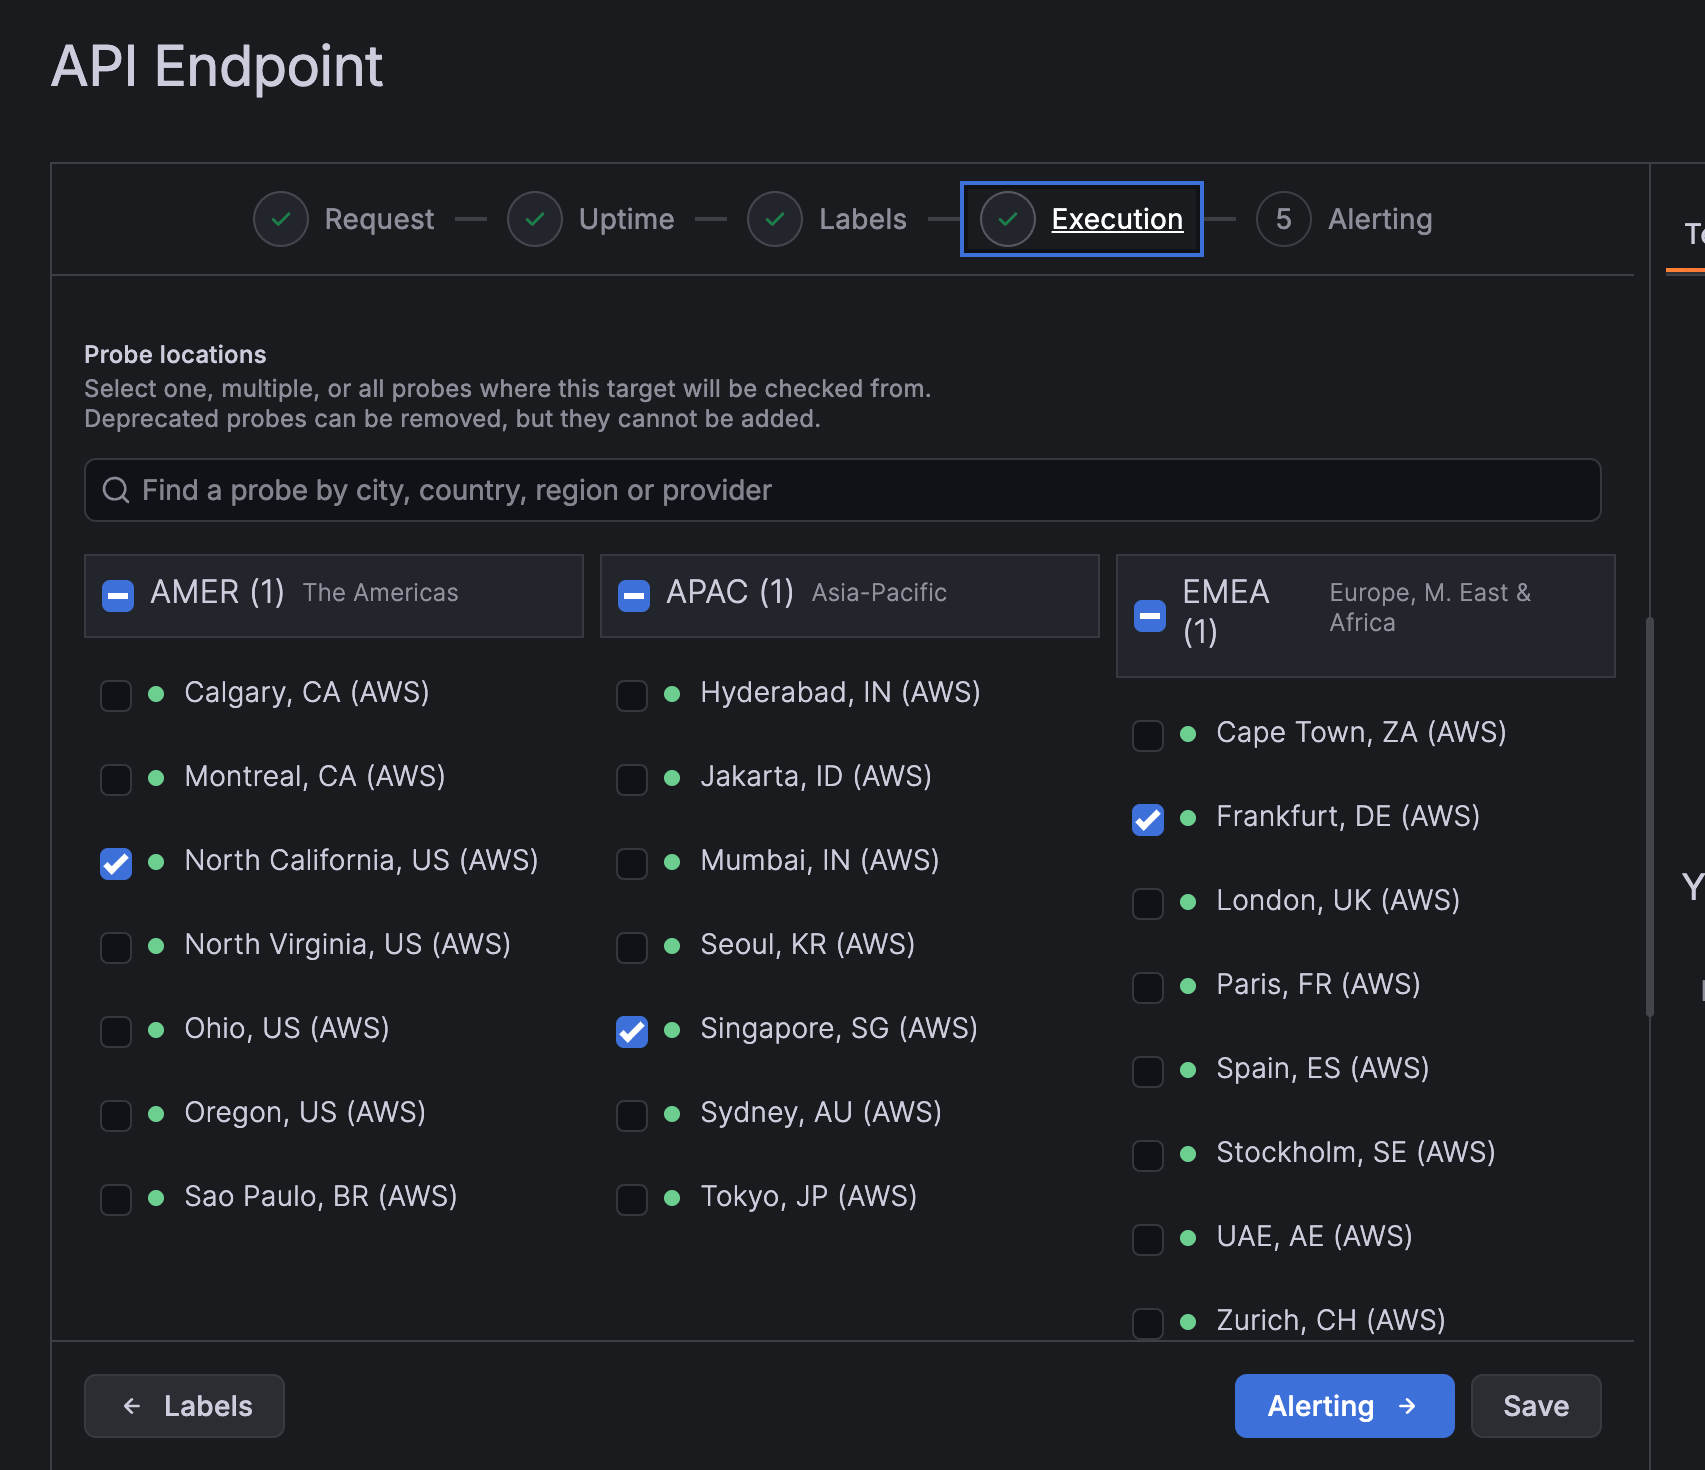
In the check creation stepper, click Execution.
In the Probe locations section, select the locations from which to run your check. For example, select North California, Singapore, and Frankfurt to test from three continents.
Leave the Frequency parameter with its default value, or adjust based on your monitoring needs. The default frequency runs checks every minute.
Click Save to create your check.
After you click Save, the check is created, and the check dashboard page is displayed. Synthetic Monitoring starts executing your check at the configured frequency. After a few executions, the Uptime, Reachability, and Latency columns populate with data.
In the next milestone, you’ll explore the check dashboard data.
More to explore (optional)
At this point in your journey, you can explore the following paths: