
Add a Group by transformation
SQL GROUP by clause. Use this when you need to aggregate data based on one or more fields, such as grouping by a specific category or region.
To use the group by transformation, complete the following steps:
Open your dashboard in edit mode.
Click Transformations tab and click + Add transformation button.
Select or search for Group by.
Select Group by on the dropdown of the field(s) that you want to group by.
To add various calculations on the other fields and apply the calculation to each group, select Calculate and a calculation type on the dropdown of the field(s) that you want to calculate.
The transformation should be applied automatically. If not, click Refresh to verify the visualization looks as intended.
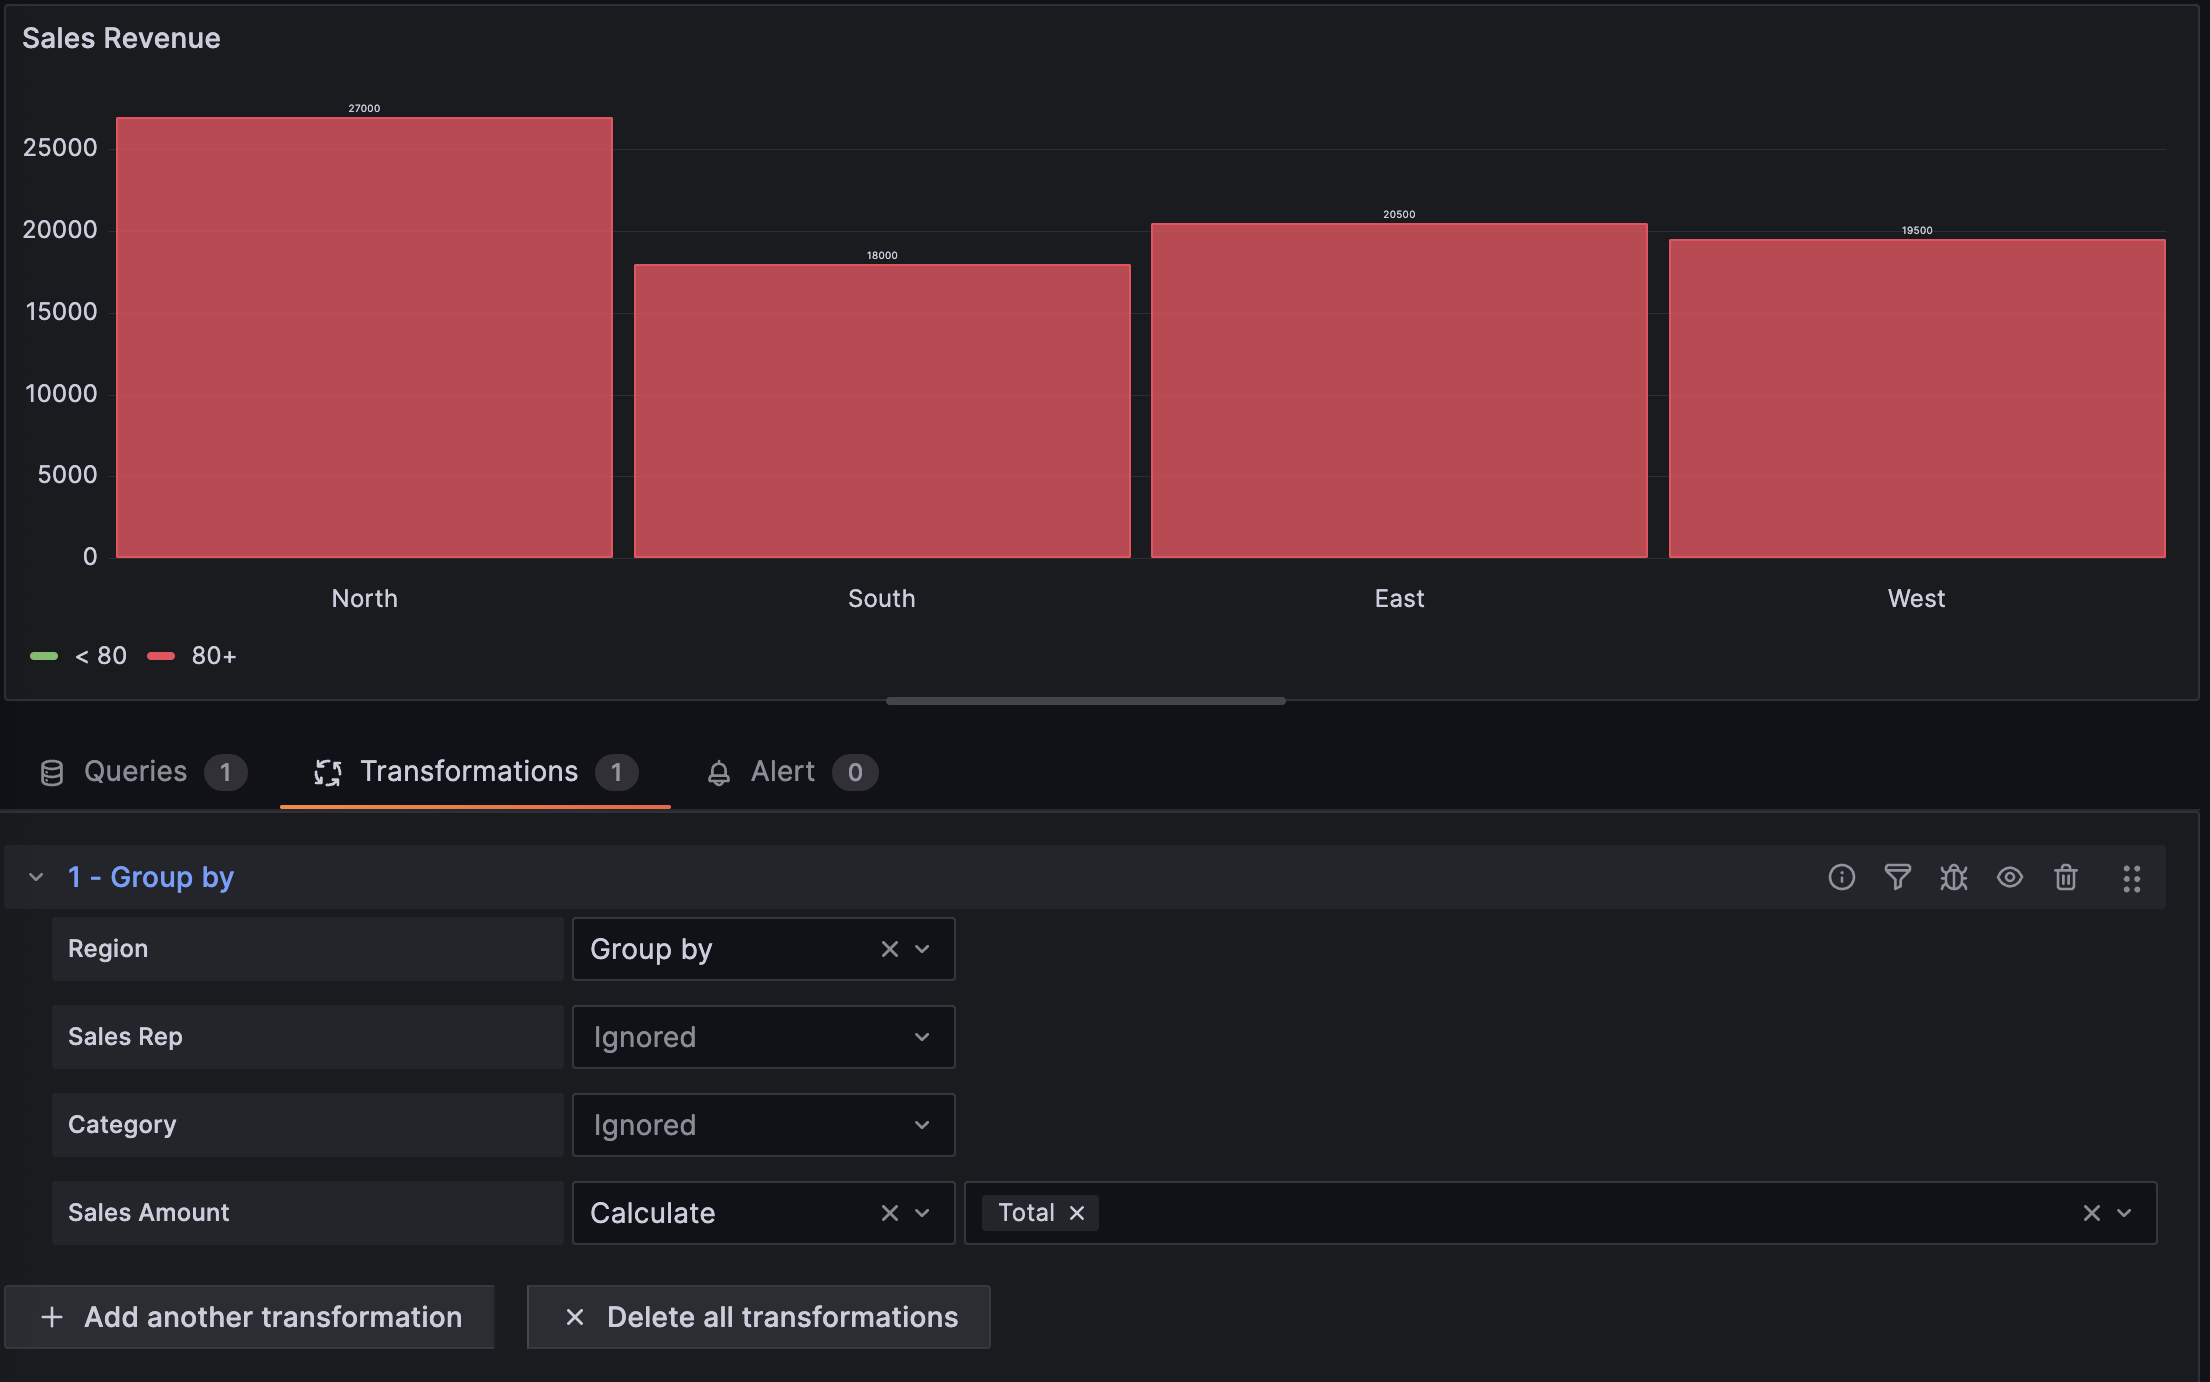
The following image shows a group by transformation that groups all similar
Regiontogether and calculates the totalSales amountper region.![Sales revenue visualization using the Group by transformation]()
Save your dashboard.
At this point in your journey, you can explore the following paths: