
Open in Grafana Cloud
Complete this learning path directly in your Grafana Cloud stack, or in the Grafana Play stack, with an interactive learning experience.
Understand billing and usage in Grafana Cloud
Welcome to the Grafana Cloud learning journey that teaches you how to understand and manage your billing and usage, identify cost drivers, and set up alerts to control spending.
Managing observability costs is critical for teams using Grafana Cloud at scale. As your monitoring grows, it’s essential to understand where costs come from and how to control them to maintain a sustainable observability strategy. Grafana Cloud provides comprehensive billing and usage dashboards that give you full transparency into your costs, helping you identify which products and features contribute to your monthly bill and providing the foundation for making informed decisions about your observability budget.
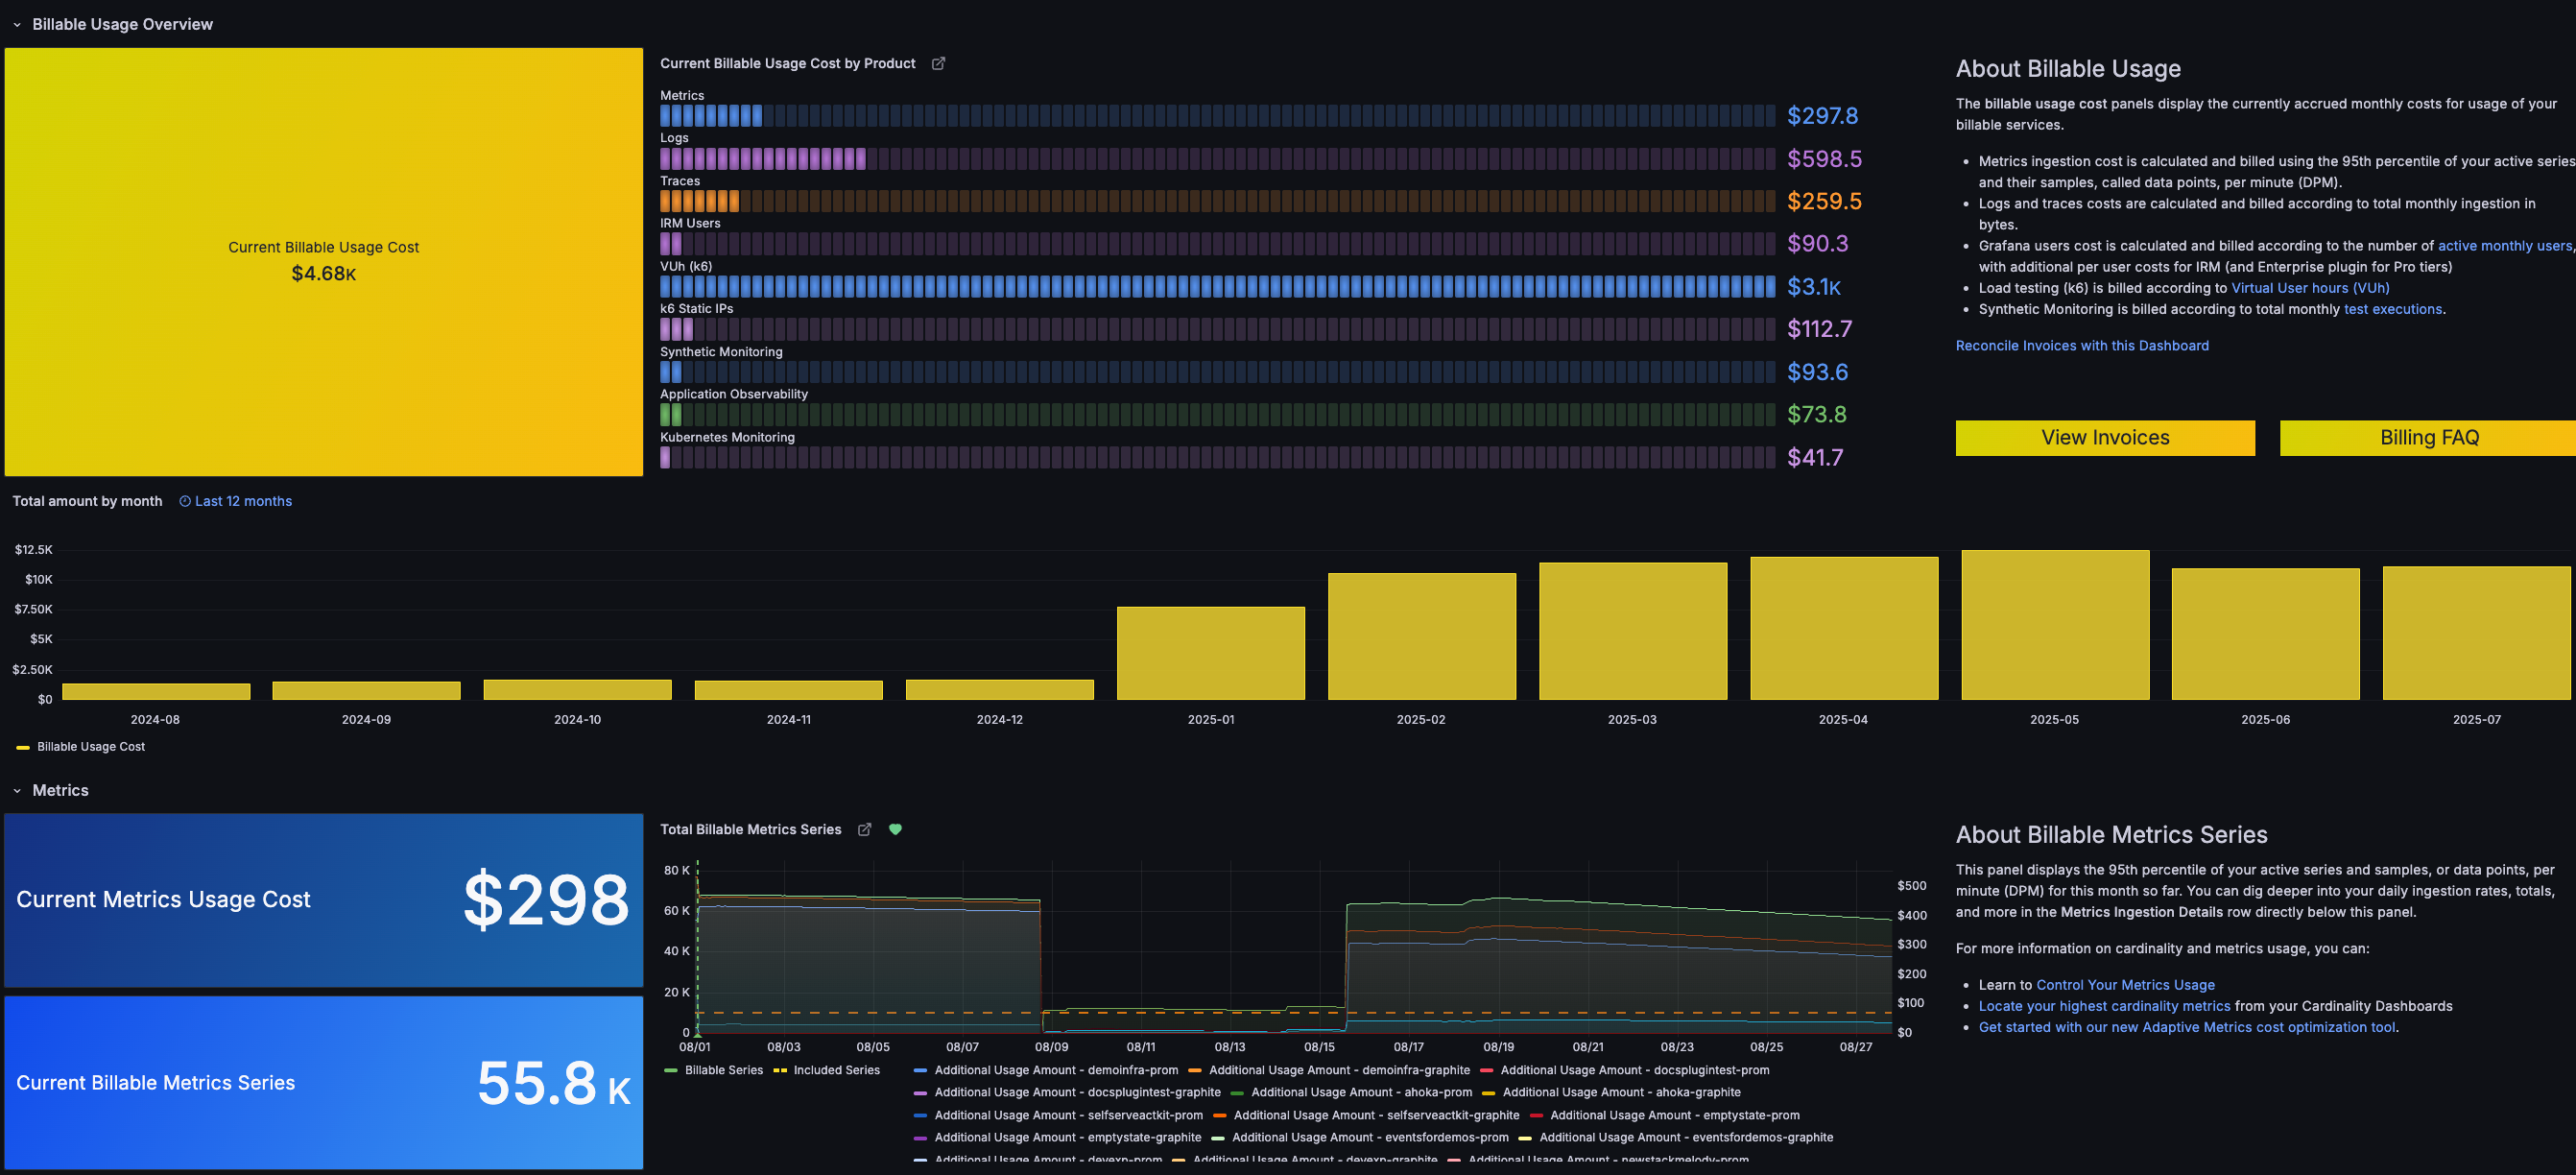
The following image of a Grafana Cloud dashboard shows an overview of usage metrics and cost breakdown.
Here’s what to expect
When you complete this journey, you’ll be able to:
- Navigate to the billing dashboard and understand its key components
- Identify which Grafana Cloud services are driving your monthly costs
- Learn how billing calculations work for metrics, logs, traces, and other services
- Create usage alerts to monitor and control your spending proactively
Before you begin
Before you understand billing and usage, ensure that you have:
- A Grafana Cloud account with active usage. To create an account, refer to Grafana Cloud.
- Admin or billing permissions in your Grafana Cloud organization
- Basic familiarity with Grafana Cloud services such as metrics, logs, and traces
Troubleshooting
If you get stuck, we’ve got your back! Where appropriate, troubleshooting information is just a click away.
More to explore
We understand you might want to explore other capabilities not strictly on this path. We’ll provide you opportunities where it makes sense.