What you get
| Feature | Description |
|---|---|
| Grafana Cloud Traces | Store and query distributed traces |
| Tempo | High-scale trace backend |
| Trace Explorer | Search and visualize traces |
| Span details | See exactly what happened at each step |
| App logs (Loki) | Structured application logs stored alongside traces |
| Trace-to-logs | Jump from any trace span directly to the relevant log lines |
| Flexible sampling | Full-fidelity or tail sampling to balance coverage and cost |
| Grafana Assistant | Investigate traces using natural language |
Questions answered
| With distributed tracing, you can answer… |
|---|
| How did this request flow through all my microservices? |
| Where did this request spend the most time? |
| Which service call failed and caused the error? |
| What database query was slow for this specific request? |
| What did downstream services return? |
| What error message and stack trace caused this failure? |
Problems solved
| Problem | Solution |
|---|---|
| “It’s slow” but don’t know where | Traces show time spent at each step. |
| Errors happen but can’t find the cause | Span details show exact error message. |
| Sampling misses important traces | Tail sampling keeps errors/slow requests; full-fidelity when needed. |
| Can’t connect trace to logs | Trace-to-logs correlation jumps from span to log lines. |
| Trace shows where but not why | App logs in Loki provide the error detail and stack trace. |
Example: Tracing a slow request
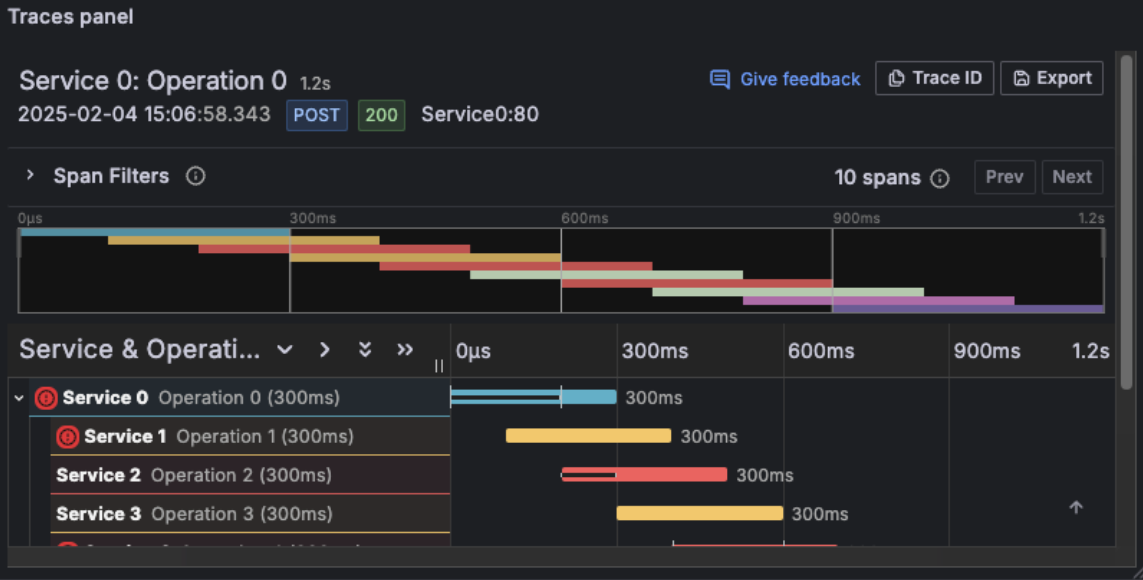
Script
Distributed tracing is the foundation of Level 3. It lets you follow a single request as it flows through your entire system. Every microservice, every database call, every external API.
In Grafana Cloud, traces are stored in Tempo, which is designed to handle massive scale at low cost. You search and explore traces using Trace Explorer, and you can click from any trace span directly to the relevant log lines.
Those log lines matter. App logs stored in Loki give you the “why” behind what the trace shows. A span tells you a request failed — the logs tell you the exact error message and stack trace that caused it.
You control how much you capture. Need every trace for debugging critical paths? You can do full-fidelity tracing.
Want to optimize costs? Use tail sampling to keep errors, slow requests, and a baseline sample. The flexibility is yours.
Imagine a request that takes 1,200 milliseconds. The trace shows you that 800 of those milliseconds were spent in a single database query.
Without tracing, you’d be guessing. With tracing, you know exactly where to optimize.
And if you don’t want to write TraceQL queries yourself, Grafana Assistant can help. Ask in natural language: “Find the service causing the highest latency” or “Show me traces with errors in the checkout service.”
The assistant generates the queries for you.