Netdata
Note
The built-in StatsD output has been deprecated on k6 v0.47.0 and removed in v0.55.0. You can continue to stream metrics to StatsD by using the xk6-output-statsd extension, or using the OpenTelemetry output depending on your use case.
For more information on the reason behind this change, you can follow this issue in the k6 repository.
k6 can send performance testing metrics to Netdata. This enables the user to start monitoring their k6 experiments right away, as Netdata is a monitoring tool with:
- Auto-configuration and auto-detection of data sources
- Automatic organization of metrics into meaningful charts and visualization
- Per-second metric granularity
Before you begin
To use the StatsD output option, you have to build a k6 binary using the xk6-output-statsd extension. For more details, refer to StatsD.
Run Netdata
Netdata runs on many different systems and platforms. The easiest way to download and run Netdata is through the kickstart script:
bash <(curl -Ss https://my-netdata.io/kickstart.sh)Alternatively, you can read more about installing and running Netdata in their documentation.
Setup Netdata for K6
Netdata runs a fully functional StatsD server by default and we have included a default configuration file for k6 metrics.
Run the k6 test
k6 run --out output-statsd script.jsMake sure you’re using the k6 binary you built with the xk6-output-statsd extension.
Caveat: By default, Netdata binds the StatsD server to localhost. That means that if Netdata and k6 are in different hosts, you will need to edit the configuration file of Netdata.
- Visit the StatsD documentation for a reference on the configuration options. We are interested in the
#bind tooption. - Use
sudo ./edit-config netdata.conffrom inside the directory where Netdata stores its configuration files (e.g/etc/netdata/) and addbind to=udp:0.0.0.0:8125.
Visualize in Netdata
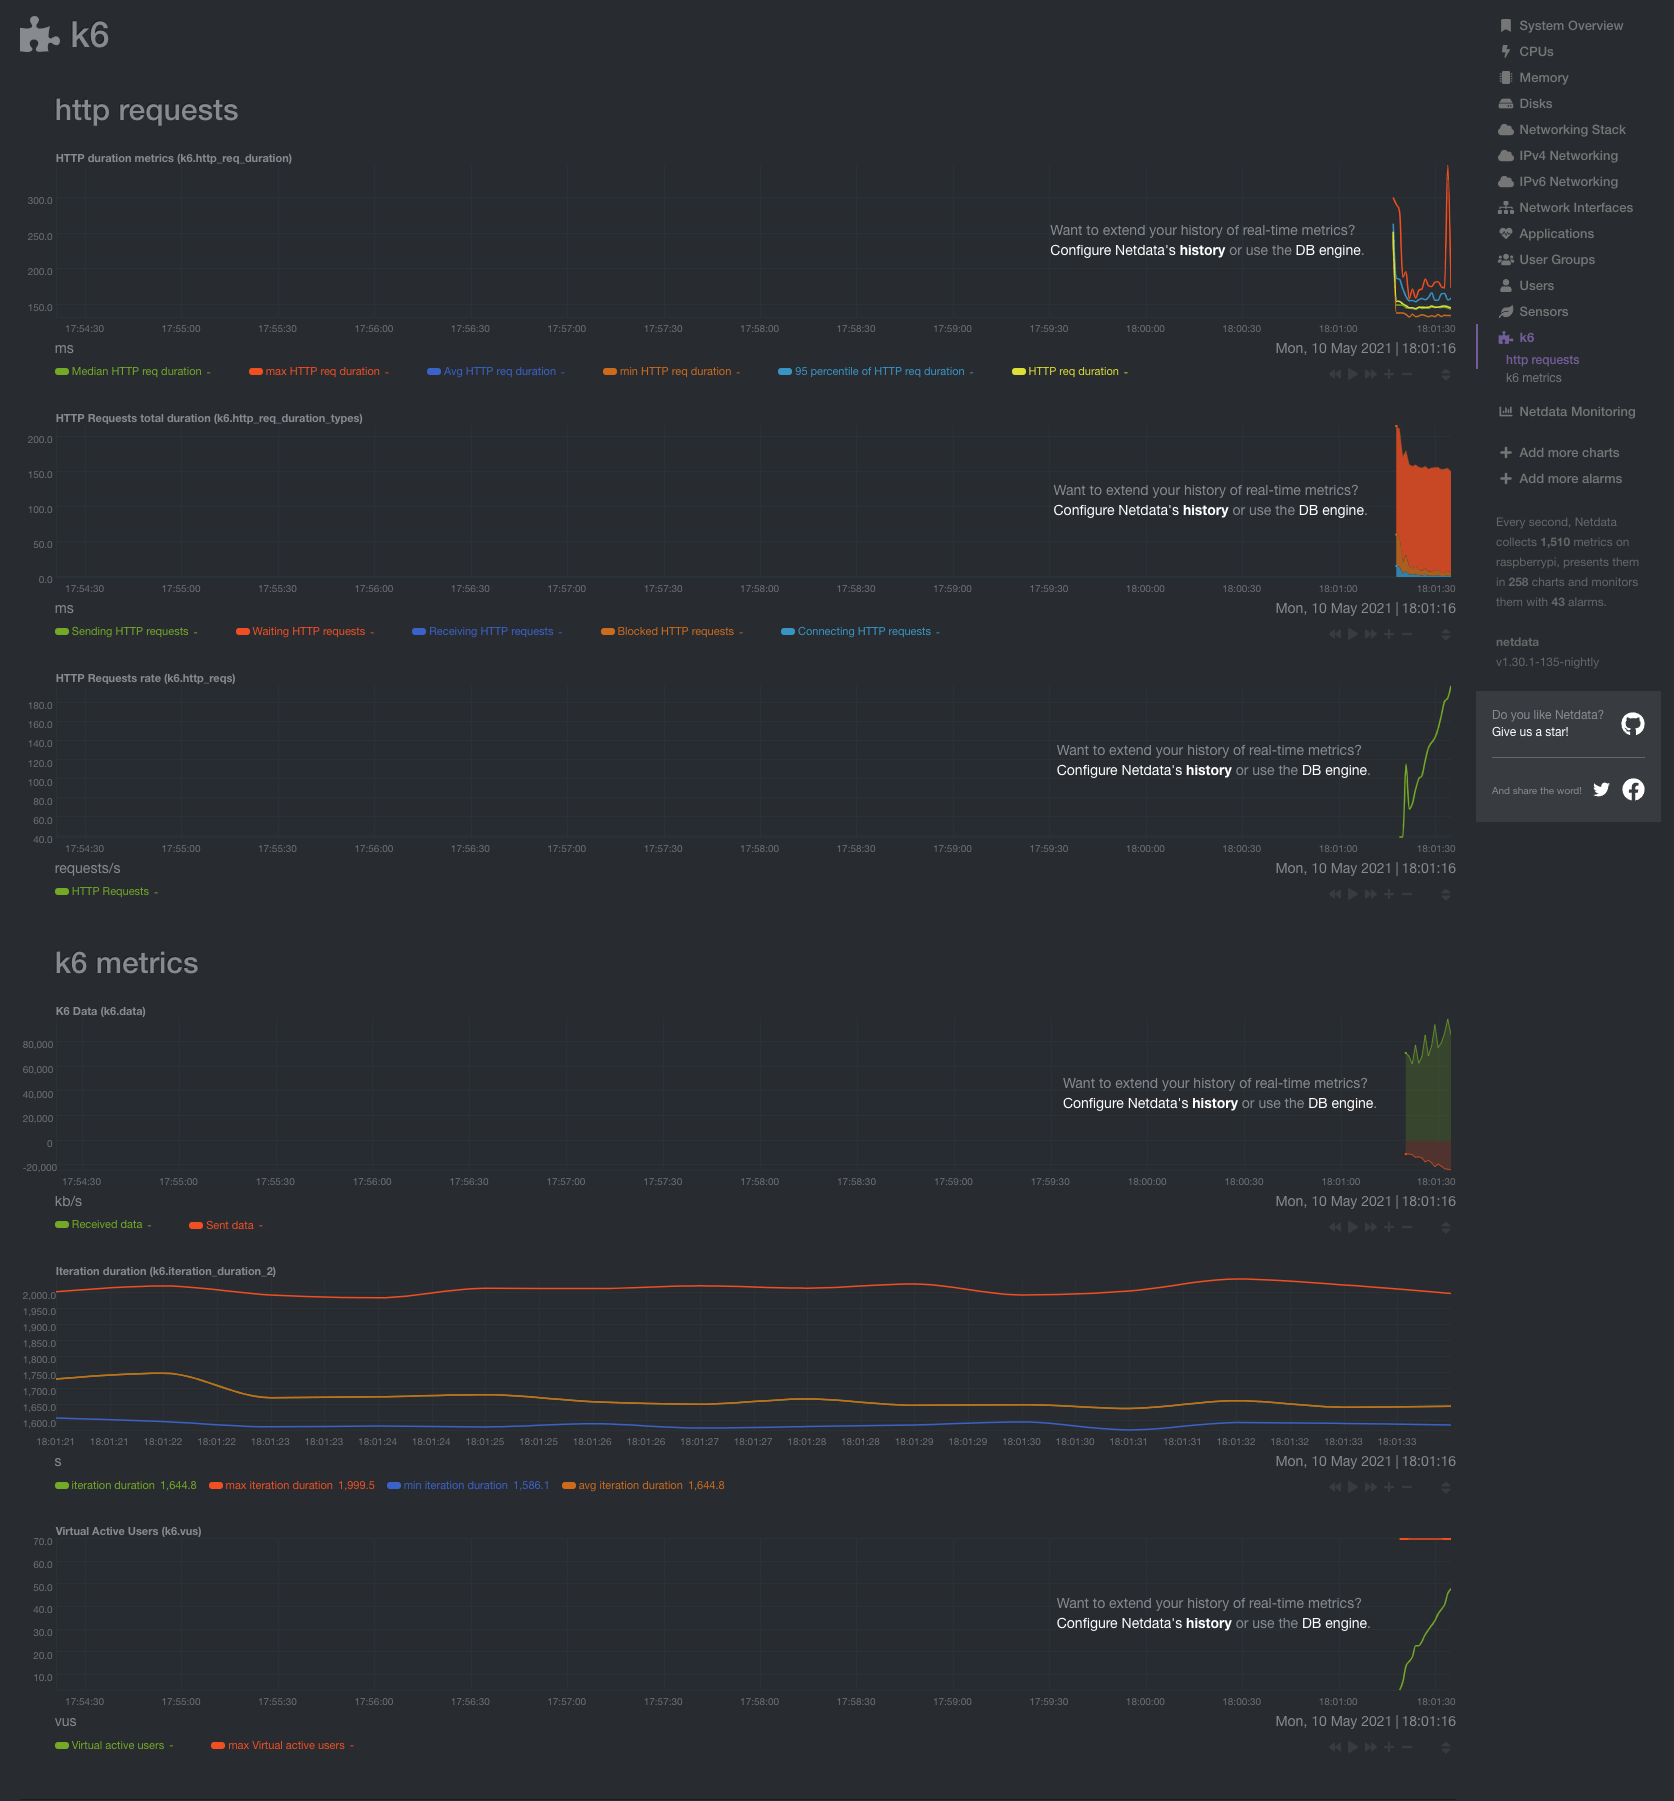
Netdata will automatically create charts for your application, as illustrated in the documentation.
Simply head over to localhost:19999 (assuming that you are running Netdata on the same machine) and find the k6 section. If you had opened Netdata before running the experiment, you will need to refresh the dashboard page.


