InfluxDB
k6 supports sending output metrics to InfluxDB v1.0 and v2.0.
Send k6 metrics to InfluxDB v1.0
k6 has built-in support to send metrics to InfluxDB v1.0.
You can use the --out flag with the influxdb option:
k6 run --out influxdb=http://localhost:8086/myk6db script.jsThe example command makes k6 connect to a local InfluxDB instance and send the results from the test to a database named myk6db. If the database doesn’t exist, k6 creates one automatically.
Send k6 metrics to InfluxDB v2.0
Using the InfluxDB extension, you can store k6 metrics in InfluxDB v2.0 and analyze your performance results with Grafana or other tools.
Build the k6 version
To build a k6 binary with the extension, first, make sure you have Go and Git installed on your machine.
Then, open your terminal and run the following commands:
# Install xk6
go install go.k6.io/xk6/cmd/xk6@latest

# Build the k6 binary
xk6 build --with github.com/grafana/xk6-output-influxdb

... [INFO] Build environment ready
... [INFO] Building k6
... [INFO] Build complete: ./k6
xk6 will create the new k6 binary in the local folder.
Note
To learn more about how to build custom k6 versions, check out xk6.
Run the test
Check that the InfluxDB instance to store the k6 metrics is running.
Use the previous k6 binary and run the test passing the following options:
K6_INFLUXDB_ORGANIZATION="<INFLUXDB-ORGANIZATION-NAME>" \
K6_INFLUXDB_BUCKET="<INFLUXDB-BUCKET-NAME>" \
K6_INFLUXDB_TOKEN="<INFLUXDB-TOKEN>" \
K6_INFLUXDB_ADDR="<INFLUXDB-HTTP-ADDRESS>" \
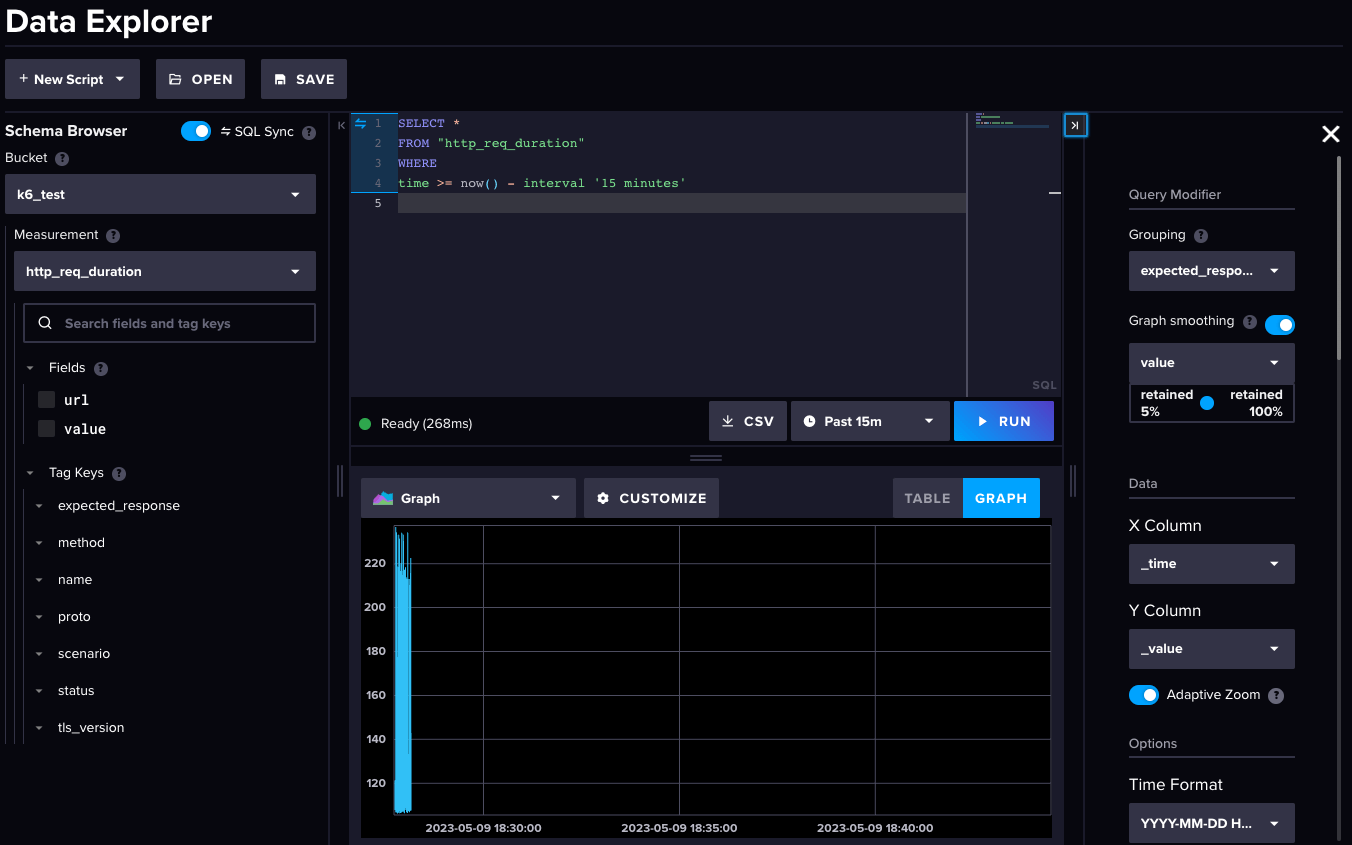
./k6 run script.js -o xk6-influxdbk6 runs the test script and sends the k6 metrics in real-time to the InfluxDB instance. You can now select the bucket to query and visualize the stored k6 metrics, for example, using the InfluxDB Data Explorer.
Options
Here is the full list of options that can be configured and passed to the extension:
Grafana Dashboards
You can use Grafana to query and visualize data from an InfluxDB instance. The instructions are available on InfluxDB and Grafana.
You can also build a custom Grafana dashboard to visualize the testing results in your own way.
For testing purposes, the InfluxDB extension repository includes a docker-compose setup with two basic dashboards.

