Important: This documentation is about an older version. It's relevant only to the release noted, many of the features and functions have been updated or replaced. Please view the current version.
What’s new in Grafana v8.4
We’re excited to announce Grafana v8.4, with a variety of improvements that focus on Grafana’s usability, performance, and security. Read on to learn about Alerting enhancements like a WeCom contact point, improved Alert panel and custom mute timings, as well as visualization improvements and details to help you share playlists more easily. In Grafana Enterprise, we’ve made caching more powerful to save you time and money while loading dashboards, boosted database encryption to keep secrets safe in your Grafana database, and made usability improvements to Recorded Queries, which allow you to track any data point over time.
We’ve summarized what’s new in the release here, but you might also be interested in the announcement blog post. If you’d like all the details you can check out the complete changelog.
OSS
Ease of use
Share playlists
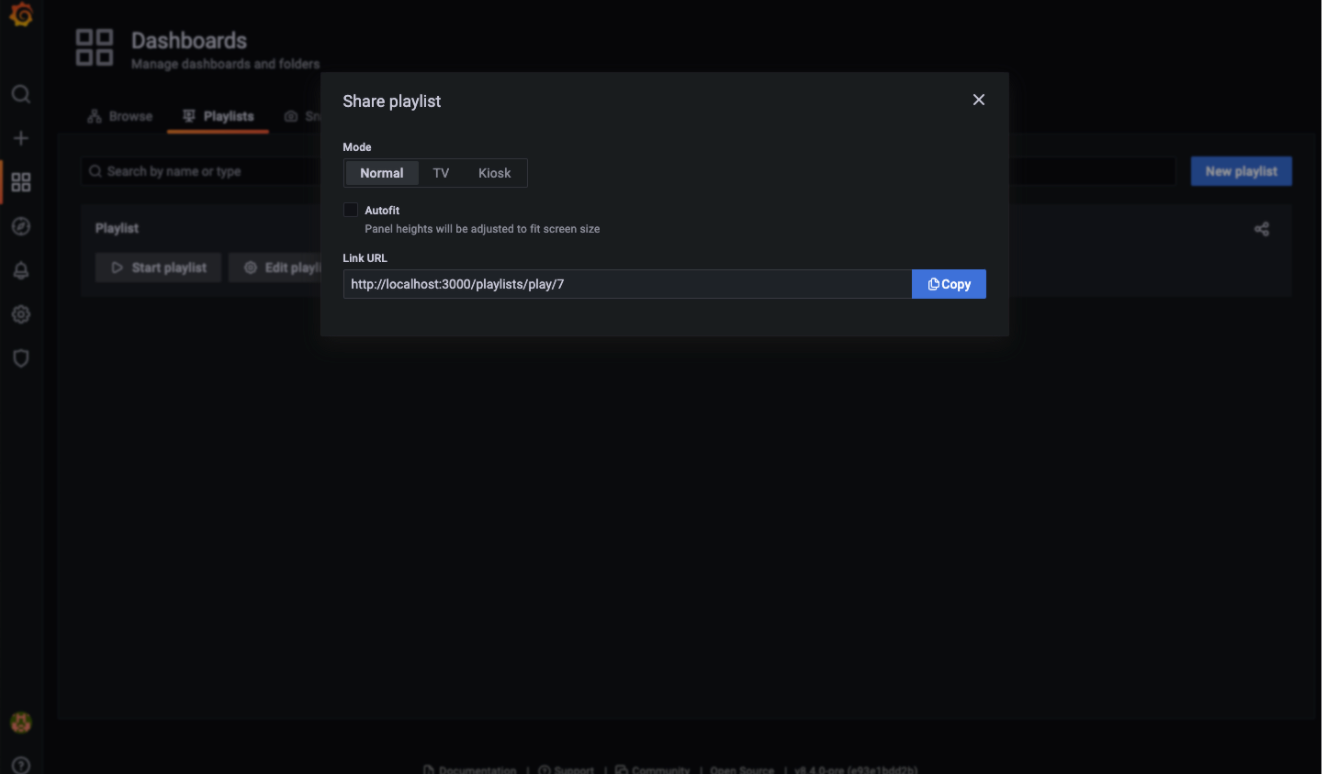
You can now share links to your playlists the same way as with dashboards, to easily set up the same playlist on multiple devices or kiosks.
$__interval and $__interval_ms in panel title
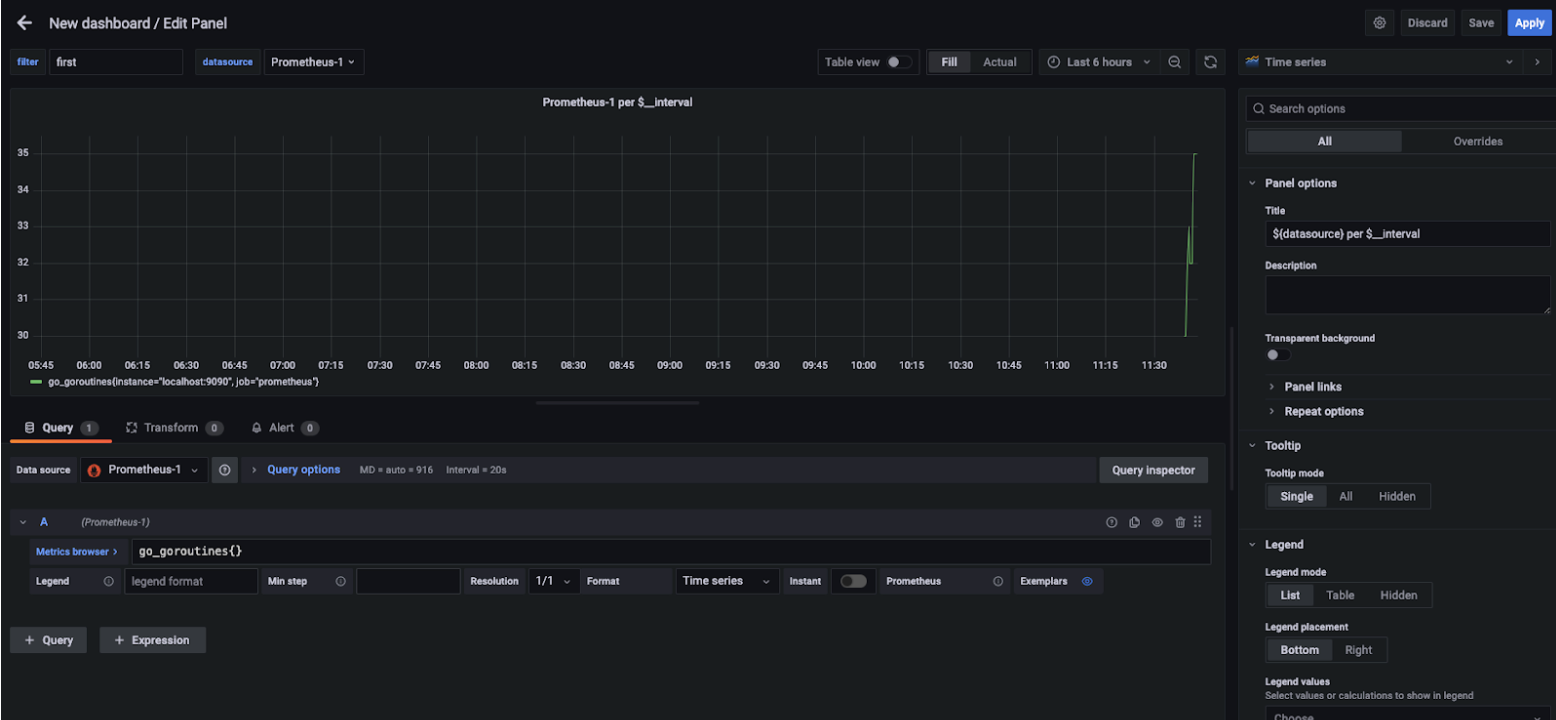
We’ve expanded the functionality of this existing and popular feature. You can now use $__interval and $__interval_ms in panel titles. This new function displays the interval that’s used in a specific panel without requiring edit mode.
Accessibility improvements
We’re continuing to improve accessibility across Grafana, particularly focusing on keyboard navigation and screen readers.
- Navigation: We’ve improved our keyboard navigation support in our main navbar, added focus states, and removed keyboard traps.
- General components (tooltips, color pickers, modals, dropdowns, and so forth): we’ve ensured they’re keyboard navigable, improved focus trapping, and improved screen reader support.
- Time series panel: charts are one of our main areas of limited accessibility. As of 8.4, you can also move a panel and make range selections using your keyboard. - Press arrow keys to move the cursor around. - Hold Shift to increase cursor speed. - Hold space to start rage selection. You can read our accessibility statement here and reach out to us with accessibility issues using our community Slack or our community forums.
New option to configure OpenTelemetry
Grafana is used to visualize traces and metrics, but Grafana itself can be traced as well. For example, users running a Grafana instance can export all the traces of endpoints and database requests to Jaeger, which helps you view all Grafana traffic.
We’re currently using OpenTracing for this, but since the repository is being deprecated, we’ve started our work to migrate to OpenTelemetry and remove OpenTracing. This release is the first step toward this goal. It also adds the option to configure OpenTelemetry instead of OpenTracing.
Rotate your encryption key
In Grafana 8.3, we upgraded Grafana to use envelope encryption, which adds a layer of indirection to the encryption process. Instead of encrypting all secrets in the database with a single key, Grafana uses a set of keys, called data encryption keys (DEKs), to encrypt them. These data encryption keys are themselves encrypted with a single key-encryption key (KEK).
As of 8.4, you can rotate your KEK and quickly re-encrypt your DEKs in case a key is compromised.
Envelope encryption is not enabled by default in version 8.4. You can enable it by adding the term envelopeEncryption to the list of feature toggles in your Grafana configuration, or by sending a request to support if you use Grafana Cloud.

Alerting
Support for mute timings
Mute timings have been a popular request from the community. They are a powerful addition to the new alerting feature set and allow you to suppress specific alerts on a recurring interval or schedule, contrary to Silences.
Paired with the existing Silences, this gives you even more control over when alerts should be sent and contact points notified.
Custom grouping for the Alert Panel
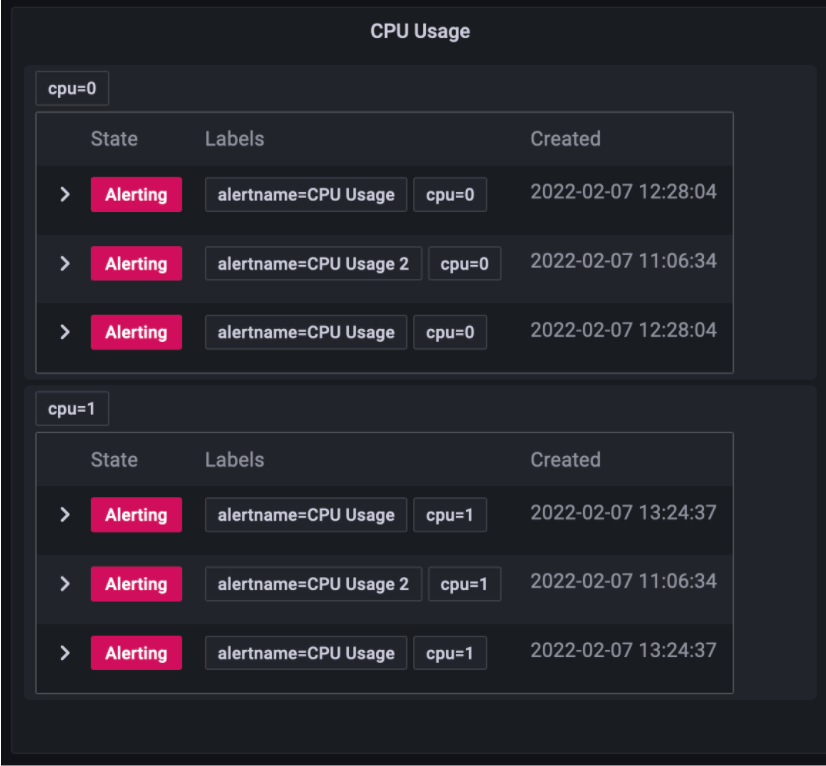
The new Alert Panel displays your alerts and associated alert instances, and supports grouping by one or more custom labels. You can also display all alert instances in an ungrouped list by choosing the custom grouping mode without any configured labels.
Traditionally alerts in the Alert Panel were grouped by the alert rule that created them. When you are monitoring a complex resource like an industrial pump, you typically have multiple alerts defined for that resource to observe different metrics. The new custom grouping feature allows you to view all alert instances for individual resource by specifying a label such as “pump identifier”.
WeCom contact point
Starting with Grafana 8.4, you can configure a WeCom contact point, to send alert notifications to WeCom.
New panel options
Bar chart
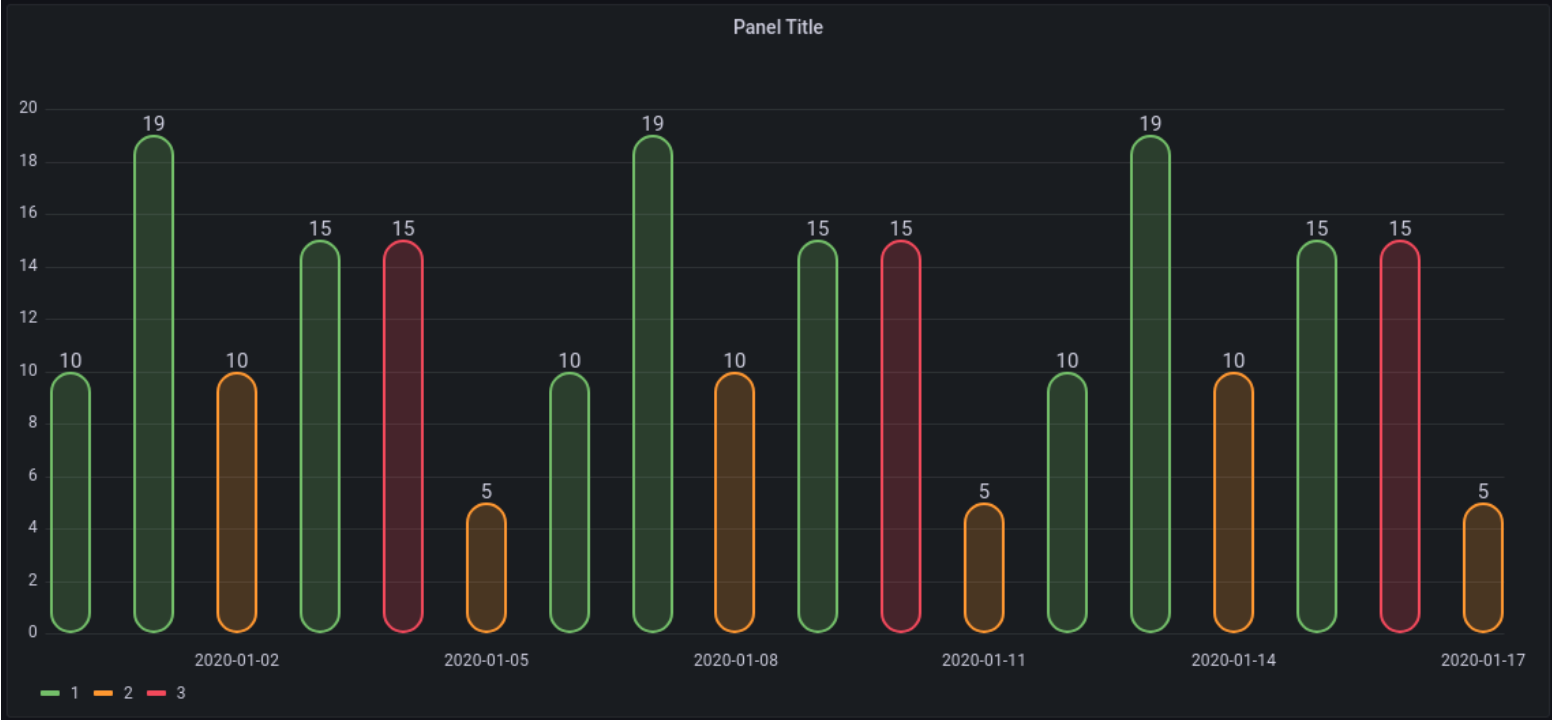
We’ve expanded the bar chart so that you can:
- Use time for the x-axis.
- Color bars using a field property (that is, build success).
- Use labels effectively:
- Skip values when there are too many labels.
- Rotate labels.
Geomap
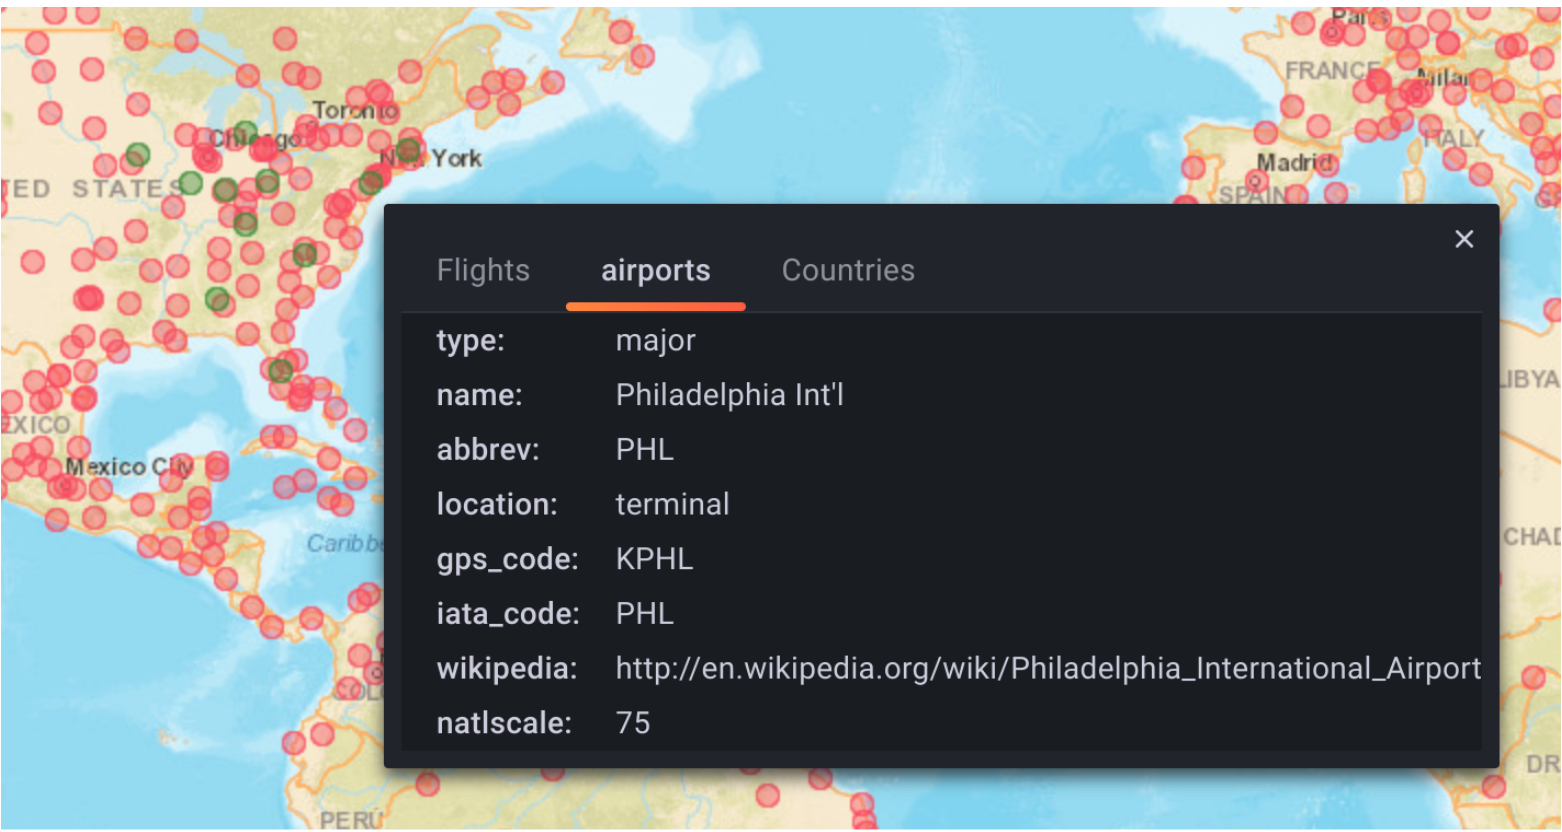
Geomap now supports tooltips with data-links across multiple layers.
OpenAPI v2 specification
The HTTP API details are now specified using OpenAPI v2.
The grafana server serves a SwaggerUI editor via the /swagger-ui endpoint that enables users to make requests to the HTTP API via the browser. This is disabled by default and it’s enabled when the swaggerUi feature toggle is set.
Grafana Enterprise
Security improvements
Role-based access control works for teams
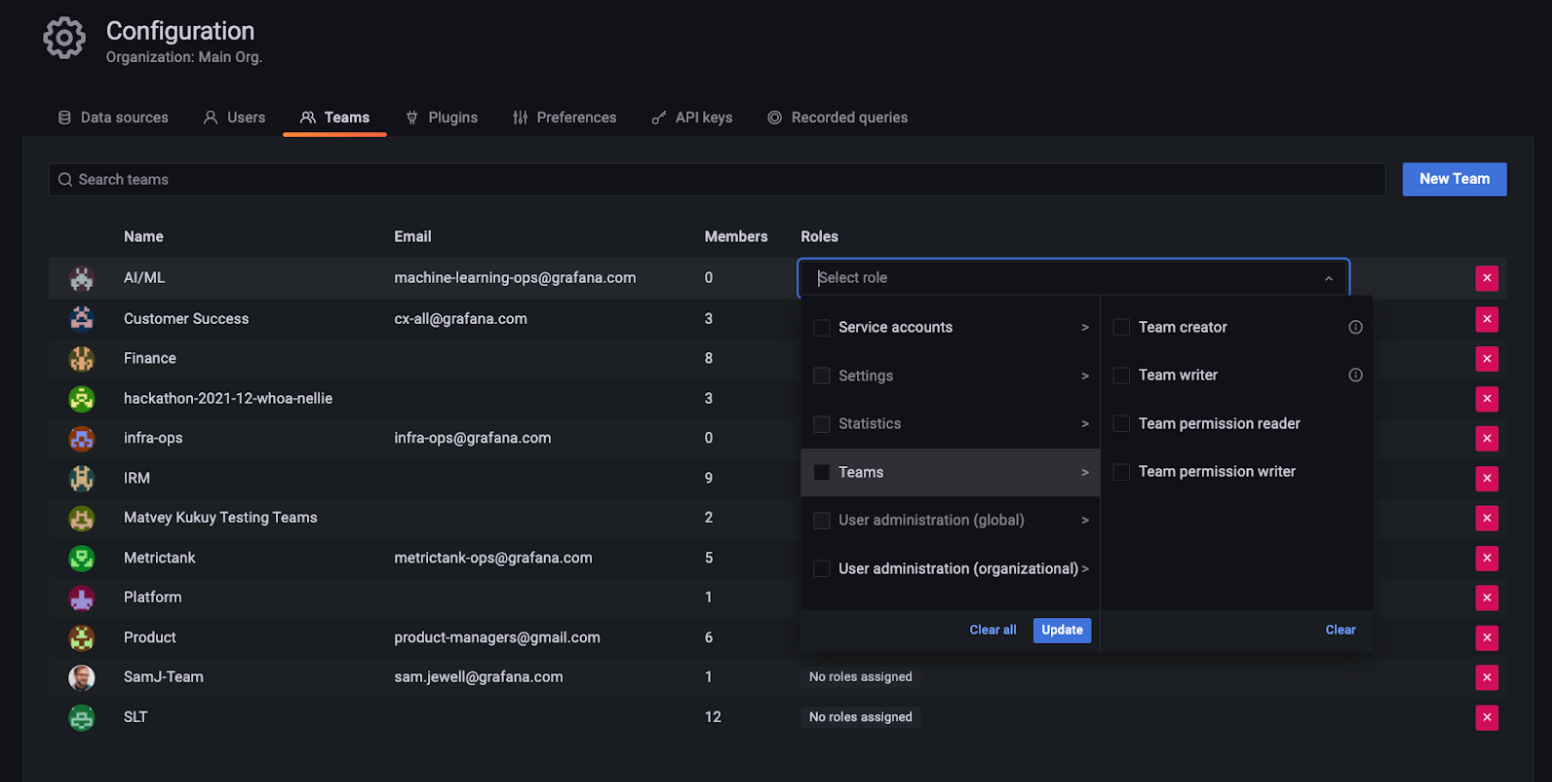
Occasionally, Viewer, Editor, and Admin roles don’t fit what a certain user needs to do in Grafana. Now you can assign role-based roles directly to users so they can create reports, use Explore mode, create data sources, and perform other specific actions in Grafana. Role-based access control is currently in beta.
In Grafana 8.4, you can assign roles to teams, which apply to all members of that team. This is a convenient way to grant certain permissions to a group of users all at once. It also makes permissions easier to manage when you synchronize groups from an SSO provider, like Google Oauth or Okta, to teams in Grafana.
In 8.4 you can also control access to Team and API key functionality itself, like viewing or editing API keys and adding members to certain teams.
Enable role-based access control by adding the term accesscontrol to the list of feature toggles in your Grafana configuration, or by sending a request to support if you use Grafana Cloud. Learn more about role-based access control in the role-based access control section of the docs.
Assign SAML users different roles in different Organizations
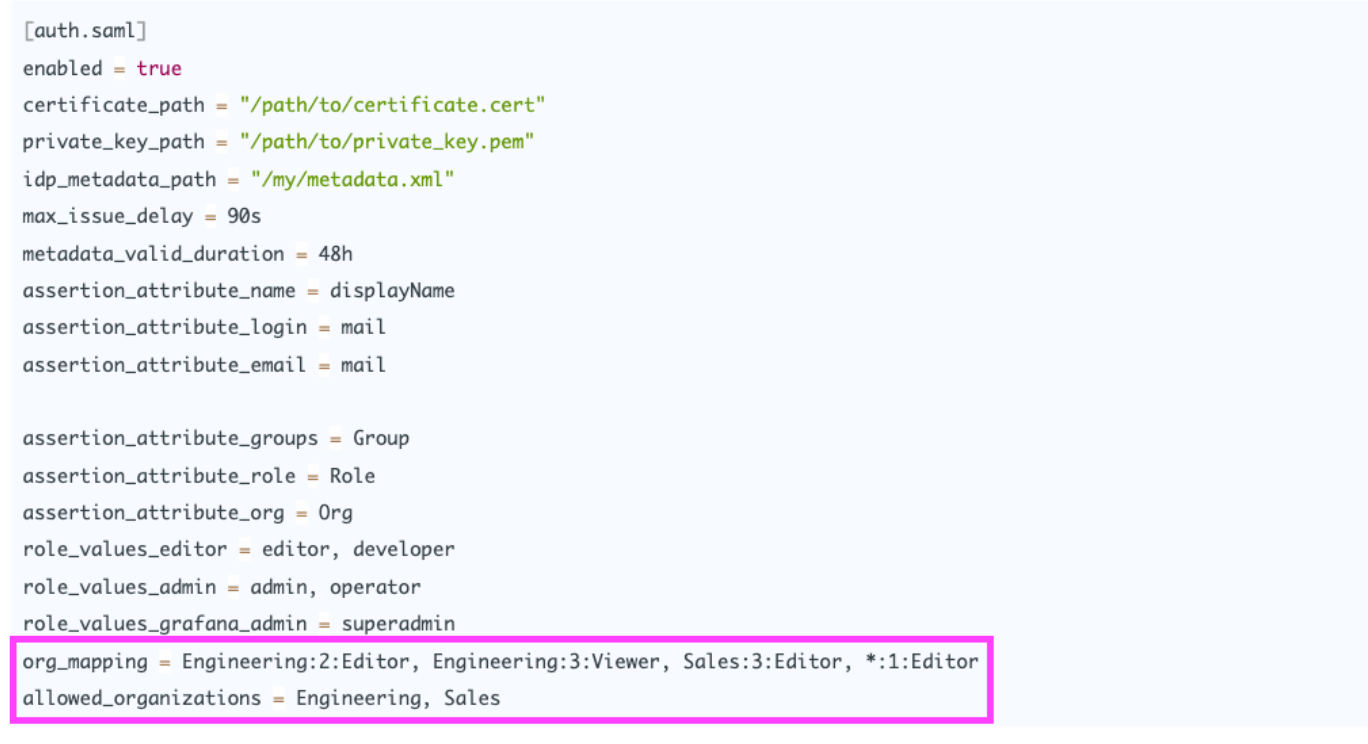
You can use Grafana’s SAML integration to map organizations in your SAML service to Organizations in Grafana so that users who authenticate using SAML have the right permissions. Previously, you could only choose a single role (Viewer, Editor, or Admin) for users, which would apply to all of their Organizations. Now, you can map a given SAML user or org to different roles in different Organizations, so that, for example, they can be a Viewer in one Organization and an Admin in another.
Additionally, you can now grant multiple SAML organizations access to Grafana, using the allowed_organizations attribute. Previously, you could only map one.
Learn more in our SAML docs.
Performance improvements
Recorded queries is more stable and usable
We’ve made stability and usability improvements to Recorded Queries, and removed the feature flag so you can get started with Recorded Queries out of the box.
Measure query cache hit rate and clear the cache
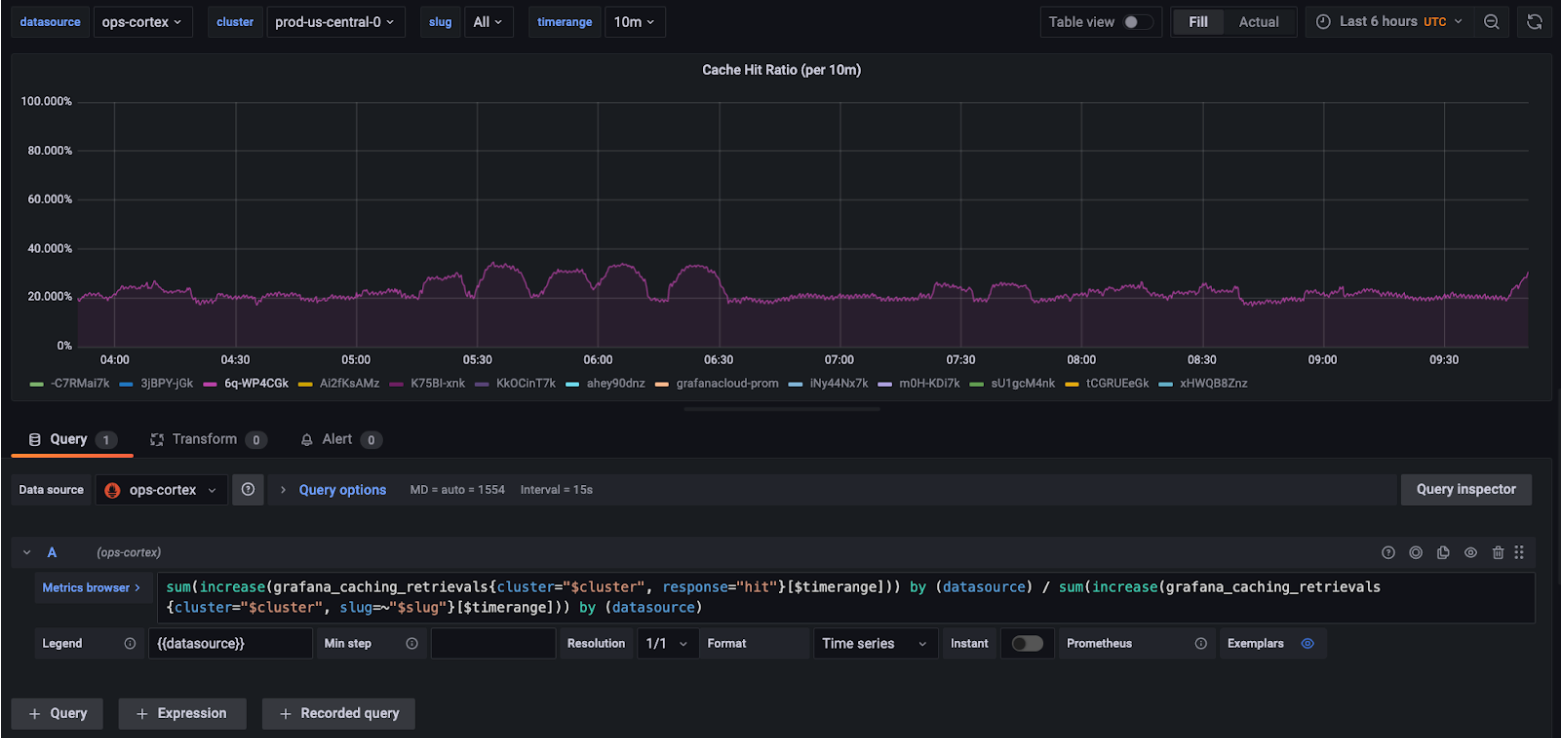
Query caching significantly reduces load times and costs of Grafana dashboards, by temporarily storing query results in a cache. Now you can measure the hit rate of your query cache, to see how many queries (and therefore how much time and money) it is saving. You can also use these measurements to tune the cache time to live (TTL), to balance performance and up-to-date data.
You can also now manually clear the cache for a given data source in case data becomes stale, so that the next set of queries run against the data source itself.
To learn more, refer to query caching in the Grafana Enterprise docs
