Important: This documentation is about an older version. It's relevant only to the release noted, many of the features and functions have been updated or replaced. Please view the current version.
Get started with Grafana and Prometheus
Prometheus is an open source monitoring system for which Grafana provides out-of-the-box support. This topic walks you through the steps to create a series of dashboards in Grafana to display system metrics for a server monitored by Prometheus.
Download Prometheus and node_exporter
Prometheus, like Grafana, can be installed on many different operating systems. Refer to the Prometheus download page, which lists all stable versions of Prometheus components. Download the following components:
Install Prometheus node_exporter
Prometheus node_exporter is a widely used tool that exposes system metrics. Install node_exporter on all hosts you want to monitor. For instructions on how to install node_exporter, refer to the Installing and running the node_exporter section in Prometheus documentation.
Note: The instructions in the referenced topic are intended for Linux users. You may have to alter the instructions slightly depending on your operating system. For example, if you are on Windows, use the windows_exporter instead.
Install and configure Prometheus
Install Prometheus following instructions in the Installation topic in the Prometheus documentation.
Configure Prometheus to monitor the hosts where you installed node_exporter. In order to do this, modify Prometheus’s configuration file. By default, Prometheus looks for the file
prometheus.ymlin the current working directory. This behavior can be changed via the--config.filecommand line flag. For example, some Prometheus installers use it to set the configuration file to/etc/prometheus/prometheus.yml. Here is an example of the code you will need to add.# A scrape configuration containing exactly one endpoint to scrape from node_exporter running on a host: scrape_configs: # The job name is added as a label `job=<job_name>` to any timeseries scraped from this config. - job_name: 'node' # metrics_path defaults to '/metrics' # scheme defaults to 'http'. static_configs: - targets: ['<hostname>:9100']Start the Prometheus service:
./prometheus --config.file=./prometheus.yml
Check Prometheus metrics in Grafana Explore view
In your Grafana instance, go to the Explore view and build queries to experiment with the metrics you want to monitor. Here you can also debug issues related to collecting metrics from Prometheus. Pay special attention to the Prometheus-specific features to avail custom querying experience for Prometheus.
Start building dashboards
Now that you have a curated list of queries, create dashboards to render system metrics monitored by Prometheus. When you install Prometheus and node_exporter or windows_exporter, you will find recommended dashboards for use.
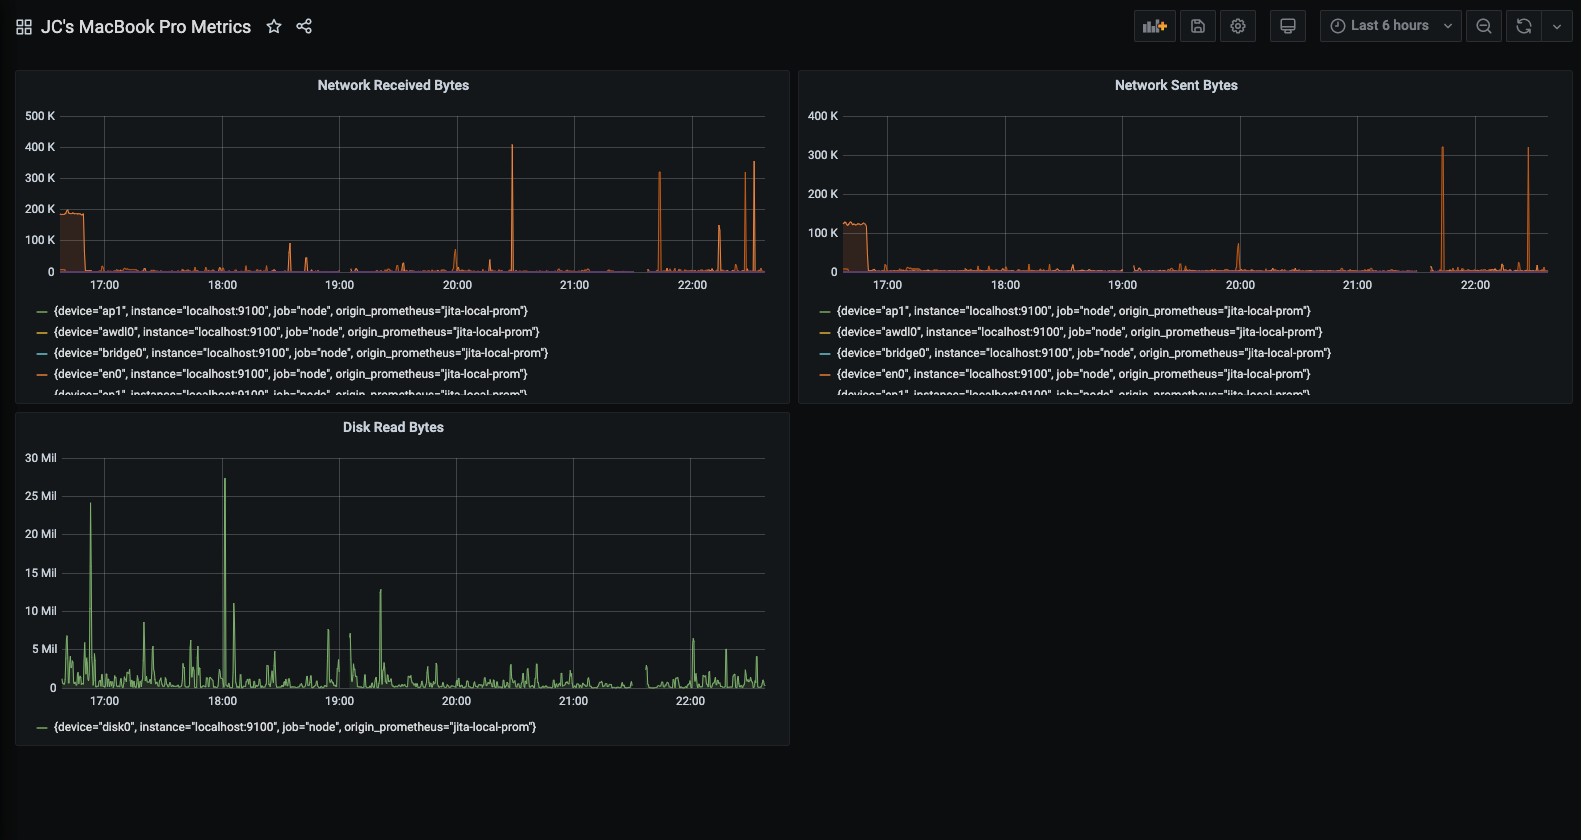
The following image shows a dashboard with three panels showing some system metrics.

To learn more:
- Grafana documentation: Prometheus data source
- Prometheus documentation: What is Prometheus?


