Important: This documentation is about an older version. It's relevant only to the release noted, many of the features and functions have been updated or replaced. Please view the current version.
MySQL data source
Starting from Grafana v5.1 you can name the time column time in addition to earlier supported time_sec. Usage of time_sec will eventually be deprecated.
Grafana ships with a built-in MySQL data source plugin that allows you to query and visualize data from a MySQL compatible database.
For instructions on how to add a data source to Grafana, refer to the administration documentation. Only users with the organization administrator role can add data sources. Administrators can also configure the data source via YAML with Grafana’s provisioning system.
Configure the data source
Data source options
Min time interval
The Min time interval setting defines a lower limit for the $__interval and $__interval_ms variables.
This value must be formatted as a number followed by a valid time identifier:
We recommend setting this value to match your MySQL write frequency.
For example, use 1m if MySQL writes data every minute.
You can also override this setting in a dashboard panel under its data source options.
Database User Permissions (Important!)
The database user you specify when you add the data source should only be granted SELECT permissions on
the specified database and tables you want to query. Grafana does not validate that the query is safe. The query
could include any SQL statement. For example, statements like USE otherdb; and DROP TABLE user; would be
executed. To protect against this we Highly recommend you create a specific mysql user with restricted permissions.
Example:
 CREATE USER 'grafanaReader' IDENTIFIED BY 'password';
 GRANT SELECT ON mydatabase.mytable TO 'grafanaReader';
You can use wildcards (*) in place of database or table if you want to grant access to more databases and tables.
Provision the data source
You can define and configure the data source in YAML files as part of Grafana’s provisioning system. For more information about provisioning, and for available configuration options, refer to Provisioning Grafana.
Provisioning example
apiVersion: 1

datasources:
  - name: MySQL
    type: mysql
    url: localhost:3306
    database: grafana
    user: grafana
    jsonData:
      maxOpenConns: 0 # Grafana v5.4+
      maxIdleConns: 2 # Grafana v5.4+
      connMaxLifetime: 14400 # Grafana v5.4+
    secureJsonData:
      password: ${GRAFANA_MYSQL_PASSWORD}
Query builder

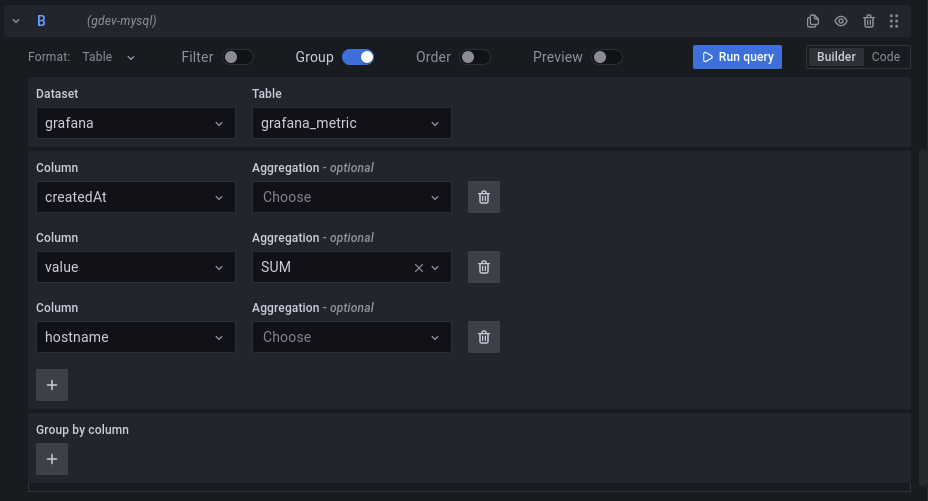
The MySQL query builder is available when editing a panel using a MySQL data source.
This topic explains querying specific to the MySQL data source. For general documentation on querying data sources in Grafana, see Query and transform data.
You can run the built query by pressing the Run query button in the top right corner of the editor.
Format
The response from MySQL can be formatted as either a table or as a time series. To use the time series format one of the columns must be named time.
Dataset and Table selection
In the dataset dropdown, choose the MySQL database to query. The dropdown is be populated with the databases that the user has access to. When the dataset is selected, the table dropdown is populated with the tables that are available.
Columns and Aggregation functions (SELECT)
Using the dropdown, select a column to include in the data. You can also specify an optional aggregation function.
Add further value columns by clicking the plus button and another column dropdown appears.
Filter data (WHERE)
To add a filter, flip the switch at the top of the editor. Using the first dropdown, select if all the filters need to match (AND) or if only one of the filters needs to match (OR).
To add more columns to filter on use the plus button.
Group By
To group the results by column, flip the group switch at the top of the editor. You can then choose which column to group the results by. The group by clause can be removed by pressing the X button.
Preview
By flipping the preview switch at the top of the editor, you can get a preview of the SQL query generated by the query builder.
Code editor

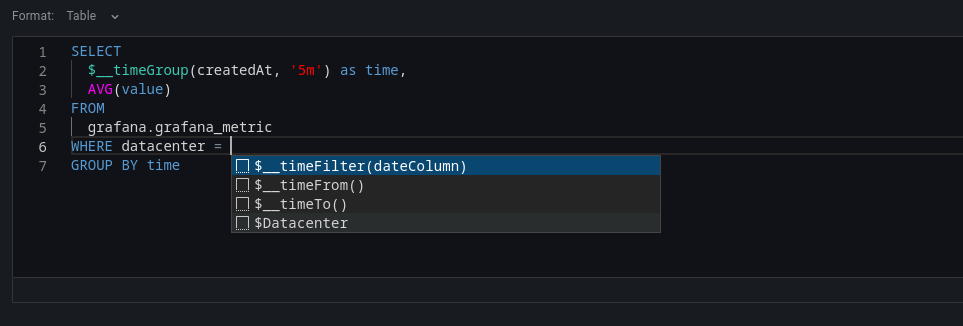
To make advanced queries, switch to the code editor by clicking code in the top right corner of the editor. The code editor support autocompletion of tables, columns, SQL keywords, standard sql functions, Grafana template variables and Grafana macros. Columns cannot be completed before a table has been specified.
You can expand the code editor by pressing the chevron pointing downwards in the lower right corner of the code editor.
CTRL/CMD + Return works as a keyboard shortcut to run the query.
Macros
To simplify syntax and to allow for dynamic parts, like date range filters, the query can contain macros.
We plan to add many more macros. If you have suggestions for what macros you would like to see, please open an issue in our GitHub repo.
The query editor has a link named Generated SQL that shows up after a query has been executed, while in panel edit mode. Click on it and it will expand and show the raw interpolated SQL string that was executed.
Table queries
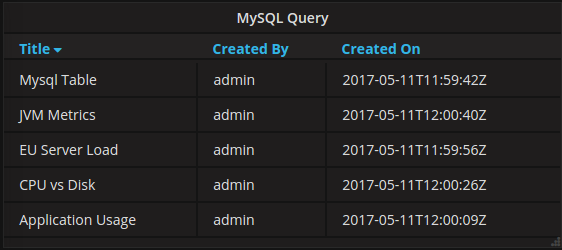
If the Format as query option is set to Table then you can basically do any type of SQL query. The table panel will automatically show the results of whatever columns and rows your query returns.
Query editor with example query:

The query:
SELECT
  title as 'Title',
  user.login as 'Created By' ,
  dashboard.created as 'Created On'
 FROM dashboard
INNER JOIN user on user.id = dashboard.created_by
WHERE $__timeFilter(dashboard.created)
You can control the name of the Table panel columns by using regular as SQL column selection syntax.
The resulting table panel:

Time series queries
If you set Format as to Time series, then the query must have a column named time that returns either a SQL datetime or any numeric datatype representing Unix epoch in seconds. In addition, result sets of time series queries must be sorted by time for panels to properly visualize the result.
A time series query result is returned in a wide data frame format. Any column except time or of type string transforms into value fields in the data frame query result. Any string column transforms into field labels in the data frame query result.
For backward compatibility, there’s an exception to the above rule for queries that return three columns including a string column named metric. Instead of transforming the metric column into field labels, it becomes the field name, and then the series name is formatted as the value of the metric column. See the example with the metric column below.
To optionally customize the default series name formatting, refer to Standard options definitions.
Example with metric column:
SELECT
  $__timeGroup(time_date_time,'5m'),
  min(value_double),
  'min' as metric
FROM test_data
WHERE $__timeFilter(time_date_time)
GROUP BY time
ORDER BY time
Data frame result:
+---------------------+-----------------+
| Name: time          | Name: min       |
| Labels:             | Labels:         |
| Type: []time.Time   | Type: []float64 |
+---------------------+-----------------+
| 2020-01-02 03:05:00 | 3               |
| 2020-01-02 03:10:00 | 6               |
+---------------------+-----------------+
Example using the fill parameter in the $__timeGroup macro to convert null values to be zero instead:
SELECT
  $__timeGroup(createdAt,'5m',0),
  sum(value_double) as value,
  hostname
FROM test_data
WHERE
  $__timeFilter(createdAt)
GROUP BY time, hostname
ORDER BY time
Given the data frame result in the following example and using the graph panel, you will get two series named value 10.0.1.1 and value 10.0.1.2. To render the series with a name of 10.0.1.1 and 10.0.1.2 , use a [Standard options definitions display value of ${__field.labels.hostname}.
Data frame result:
+---------------------+---------------------------+---------------------------+
| Name: time          | Name: value               | Name: value               |
| Labels:             | Labels: hostname=10.0.1.1 | Labels: hostname=10.0.1.2 |
| Type: []time.Time   | Type: []float64           | Type: []float64           |
+---------------------+---------------------------+---------------------------+
| 2020-01-02 03:05:00 | 3                         | 4                         |
| 2020-01-02 03:10:00 | 6                         | 7                         |
+---------------------+---------------------------+---------------------------+
Example with multiple columns:
SELECT
  $__timeGroup(time_date_time,'5m'),
  min(value_double) as min_value,
  max(value_double) as max_value
FROM test_data
WHERE $__timeFilter(time_date_time)
GROUP BY time
ORDER BY time
Data frame result:
+---------------------+-----------------+-----------------+
| Name: time          | Name: min_value | Name: max_value |
| Labels:             | Labels:         | Labels:         |
| Type: []time.Time   | Type: []float64 | Type: []float64 |
+---------------------+-----------------+-----------------+
| 2020-01-02 03:04:00 | 3               | 4               |
| 2020-01-02 03:05:00 | 6               | 7               |
+---------------------+-----------------+-----------------+
Currently, there is no support for a dynamic group by time based on time range and panel width. This is something we plan to add.
Templating
This feature is currently available in the nightly builds and will be included in the 5.0.0 release.
Instead of hard-coding things like server, application and sensor name in your metric queries you can use variables in their place. Variables are shown as dropdown select boxes at the top of the dashboard. These dropdowns make it easy to change the data being displayed in your dashboard.
Check out the Templating documentation for an introduction to the templating feature and the different types of template variables.
Query Variable
If you add a template variable of the type Query, you can write a MySQL query that can
return things like measurement names, key names or key values that are shown as a dropdown select box.
For example, you can have a variable that contains all values for the hostname column in a table if you specify a query like this in the templating variable Query setting.
SELECT hostname FROM my_hostA query can return multiple columns and Grafana will automatically create a list from them. For example, the query below will return a list with values from hostname and hostname2.
SELECT my_host.hostname, my_other_host.hostname2 FROM my_host JOIN my_other_host ON my_host.city = my_other_host.cityTo use time range dependent macros like $__timeFilter(column) in your query the refresh mode of the template variable needs to be set to On Time Range Change.
SELECT event_name FROM event_log WHERE $__timeFilter(time_column)Another option is a query that can create a key/value variable. The query should return two columns that are named __text and __value. The __text column value should be unique (if it is not unique then the first value is used). The options in the dropdown will have a text and value that allows you to have a friendly name as text and an id as the value. An example query with hostname as the text and id as the value:
SELECT hostname AS __text, id AS __value FROM my_hostYou can also create nested variables. For example if you had another variable named region. Then you could have
the hosts variable only show hosts from the current selected region with a query like this (if region is a multi-value variable then use the IN comparison operator rather than = to match against multiple values):
SELECT hostname FROM my_host WHERE region IN($region)Using __searchFilter to filter results in Query Variable
Available from Grafana 6.5 and above
Using __searchFilter in the query field will filter the query result based on what the user types in the dropdown select box.
When nothing has been entered by the user the default value for __searchFilter is %.
Important that you surround the
__searchFilterexpression with quotes as Grafana does not do this for you.
The example below shows how to use __searchFilter as part of the query field to enable searching for hostname while the user types in the dropdown select box.
Query
SELECT hostname FROM my_host WHERE hostname LIKE '$__searchFilter'Using Variables in Queries
From Grafana 4.3.0 to 4.6.0, template variables are always quoted automatically so if it is a string value do not wrap them in quotes in where clauses.
From Grafana 4.7.0, template variable values are only quoted when the template variable is a multi-value.
If the variable is a multi-value variable then use the IN comparison operator rather than = to match against multiple values.
There are two syntaxes:
$<varname> Example with a template variable named hostname:
SELECT
  UNIX_TIMESTAMP(atimestamp) as time,
  aint as value,
  avarchar as metric
FROM my_table
WHERE $__timeFilter(atimestamp) and hostname in($hostname)
ORDER BY atimestamp ASC
[[varname]] Example with a template variable named hostname:
SELECT
  UNIX_TIMESTAMP(atimestamp) as time,
  aint as value,
  avarchar as metric
FROM my_table
WHERE $__timeFilter(atimestamp) and hostname in([[hostname]])
ORDER BY atimestamp ASC
Disabling Quoting for Multi-value Variables
Grafana automatically creates a quoted, comma-separated string for multi-value variables. For example: if server01 and server02 are selected then it will be formatted as: 'server01', 'server02'. Do disable quoting, use the csv formatting option for variables:
${servers:csv}
Read more about variable formatting options in the Variables documentation.
Annotations
Annotations allow you to overlay rich event information on top of graphs. You add annotation queries via the Dashboard menu / Annotations view.
Example query using time column with epoch values:
SELECT
  epoch_time as time,
  metric1 as text,
  CONCAT(tag1, ',', tag2) as tags
FROM
  public.test_data
WHERE
  $__unixEpochFilter(epoch_time)
Example region query using time and timeend columns with epoch values:
Only available in Grafana v6.6+.
SELECT
  epoch_time as time,
  epoch_timeend as timeend,
  metric1 as text,
  CONCAT(tag1, ',', tag2) as tags
FROM
  public.test_data
WHERE
  $__unixEpochFilter(epoch_time)
Example query using time column of native SQL date/time data type:
SELECT
  native_date_time as time,
  metric1 as text,
  CONCAT(tag1, ',', tag2) as tags
FROM
  public.test_data
WHERE
$__timeFilter(native_date_time)Alerting
Time series queries should work in alerting conditions. Table formatted queries are not yet supported in alert rule conditions.


