Important: This documentation is about an older version. It's relevant only to the release noted, many of the features and functions have been updated or replaced. Please view the current version.
Amazon CloudWatch query editor
This topic explains querying specific to the CloudWatch data source. For general documentation on querying data sources in Grafana, see Query and transform data.
Choose a query editing mode
The CloudWatch data source can query data from both CloudWatch metrics and CloudWatch Logs APIs, each with its own specialized query editor.

Select which API to query by using the query mode switch on top of the editor.
Query CloudWatch metrics
You can build two types of queries with the CloudWatch query editor:
- Metric Search
- Metric Query, which uses the Metrics Insights feature
Create a Metric Search query
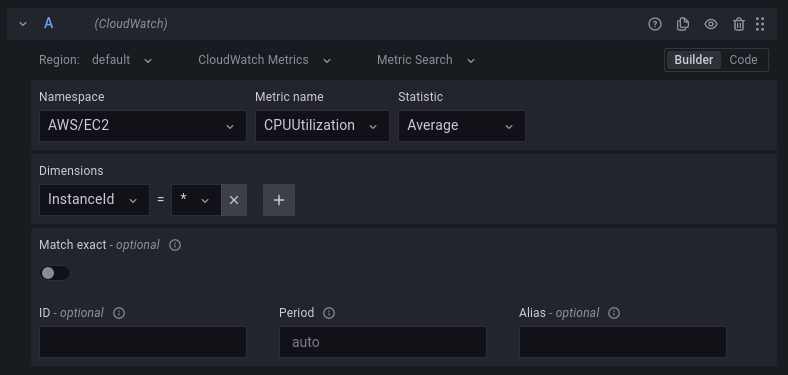
To create a valid Metric Search query, specify the namespace, metric name, and at least one statistic.
If you enable Match Exact, you must also specify all dimensions of the metric you’re querying so that the metric schema matches exactly.
If Match Exact is disabled, you can specify any number of dimensions on which you’d like to filter.
The data source returns up to 100 metrics matching your filter criteria.
You can also augment queries by using template variables.
Create dynamic queries with dimension wildcards
Use the asterisk (*) wildcard for one or more dimension values to monitor a dynamic list of metrics.

In this example, the query returns all metrics in the namespace AWS/EC2 with a metric name of CPUUtilization, and also queries ANY value for the InstanceId dimension.
This can help you monitor metrics for AWS resources, like EC2 instances or containers.
When an auto-scaling event creates new instances, they automatically appear in the graph without you having to track the new instance IDs. This capability is currently limited to retrieving up to 100 metrics.
You can expand the Query inspector button and click Meta Data to see the search expression that’s automatically built to support wildcards.
To learn more about search expressions, refer to the CloudWatch documentation. The search expression is defined by default in such a way that the queried metrics must match the defined dimension names exactly. This means that in the example, the query returns only metrics with exactly one dimension containing the name ‘InstanceId’.

You can disable Match Exact to include metrics that have other dimensions defined.
Disabling Match Exact also creates a search expression even if you don’t use wildcards. We simply search for any metric that matches at least the namespace, metric name, and all defined dimensions.
Use multi-value template variables
When defining dimension values based on multi-valued template variables, the data source uses a search expression to query for the matching metrics.
This enables the use of multiple template variables in one query, and also lets you use template variables for queries that have the Match Exact option disabled.
Search expressions are limited to 1,024 characters, so your query might fail if you have a long list of values.
We recommend using the asterisk (*) wildcard instead of the All option to query all metrics that have any value for a certain dimension name.
The use of multi-valued template variables is supported only for dimension values.
Using multi-valued template variables for Region, Namespace, or Metric Name is not supported.
Use metric math expressions
You can create new time series metrics by operating on top of CloudWatch metrics using mathematical functions. This includes support for arithmetic operators, unary subtraction, and other functions, and can be applied to CloudWatch metrics. For details on the available functions, refer to AWS Metric Math.
For example, to apply arithmetic operations to a metric, apply a unique string id to the raw metric, then use this id and apply arithmetic operations to it in the Expression field of the new metric.
Note: If you use the expression field to reference another query, like
queryA * 2, you can’t create an alert rule based on that query.
Deep-link Grafana panels to the CloudWatch console

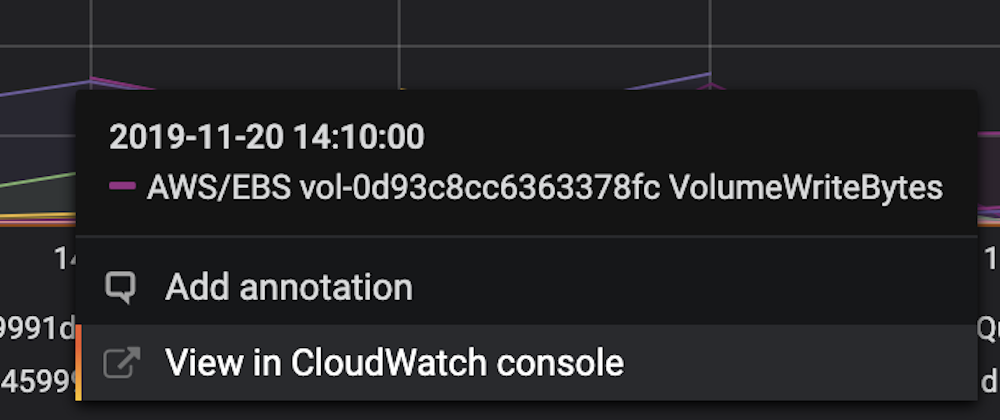
Left-clicking a time series in the panel shows a context menu with a link to View in CloudWatch console.
Clicking that link opens a new tab that takes you to the CloudWatch console and displays all metrics for that query.
If you’re not logged in to the CloudWatch console, the link forwards you to the login page.
The provided link is valid for any account but displays the expected metrics only if you’re logged in to the account that corresponds to the selected data source in Grafana.
This feature is not available for metrics based on metric math expressions.
Create a Metric Insights query
Note: This query option is available only in Grafana v8.3 and higher.
The Metrics Query option in the CloudWatch data source is referred to as Metric Insights in the AWS console. It’s a fast, flexible, SQL-based query engine that you can use to identify trends and patterns across millions of operational metrics in real time.
The metrics query editor’s Metrics Query option has two editing modes:
- Builder mode, which provides a visual query-building interface
- Code mode, which provides a code editor for writing queries
Use Metric Insights syntax
Metric Insights uses a dialect of SQL and this query syntax:
SELECT FUNCTION(MetricName)
FROM Namespace | SCHEMA(...)
[ WHERE labelKey OPERATOR labelValue [AND|...]]
[ GROUP BY labelKey [, ...]]
[ ORDER BY FUNCTION() [DESC | ASC] ]
[ LIMIT number]
For details about the Metrics Insights syntax, refer to the AWS reference documentation.
For information about Metrics Insights limits, refer to the AWS feature documentation.
You can also augment queries by using template variables.
Use Metrics Insights keywords
This table summarizes common Metrics Insights query keywords:
Create a query in Builder mode
To create a query in Builder mode:
- Browse and select a metric namespace, metric name, filter, group, and order options using information from the Metrics Insights keywords table.
- For each of these keywords, choose from the list of possible options.
Grafana constructs a SQL query based on your selections.
Create a query in Code mode
You can also write your SQL query directly in a code editor by using Code mode.
The code editor has a built-in autocomplete feature that suggests keywords, aggregations, namespaces, metrics, labels, and label values.
The suggestions appear after typing a space, comma, or dollar ($) character, or the keyboard combination

Note: Template variables in the code editor can interfere with autocompletion.
To run the query, click Run query above the code editor.
Common query editor fields
Three fields located at the bottom of the metrics query editor are common to both Metric Search and Metric Query editors.
Id
The GetMetricData API requires that all queries have a unique ID. Use this field to specify an ID of choice. The ID can include numbers, letters, and underscore, and must start with a lowercase letter. If no ID is specified, grafana will generate an ID using the following pattern query[refId of the current query row], such as queryA for the first query row in the panel editor.
The ID can be used to reference queries in Metric Math expressions.
Period
A period is the length of time associated with a specific Amazon CloudWatch statistic. Periods are defined in numbers of seconds, and valid values for period are 1, 5, 10, 30, or any multiple of 60.
If the period field is left blank or set to auto, then it calculates automatically based on the time range and cloudwatch’s retention policy. The formula used is time range in seconds / 2000, and then it snaps to the next higher value in an array of predefined periods [60, 300, 900, 3600, 21600, 86400] after removing periods based on retention. By clicking Show Query Preview in the query editor, you can see what period Grafana used.
Label
The label field allows you to override the default name of the metric legend using CloudWatch dynamic labels. If you’re using a time-based dynamic label such as ${MIN_MAX_TIME_RANGE}, then the legend value is derived from the current timezone specified in the time range picker. To see the full list of label patterns and the dynamic label limitations, refer to the CloudWatch dynamic labels documentation.
Alias pattern deprecation: Since Grafana v9.0, dynamic labels replaced alias patterns in the CloudWatch data source. Any existing alias pattern is migrated upon upgrade to a corresponding dynamic label pattern. To use alias patterns instead of dynamic labels, set the feature toggle
cloudWatchDynamicLabelstofalsein the Grafana configuration file. This reverts to the alias pattern system and uses the previous alias formatting logic.
The alias field will be deprecated and removed in a release. During this interim period, we won’t fix bugs related to the alias pattern system. For details on why we’re changing this feature, refer to issue #48434.
Query CloudWatch Logs
The logs query editor helps you write CloudWatch Logs Query Language queries across defined regions and log groups.
Create a CloudWatch Logs query
- Select the region and up to 20 log groups to query.
- Use the main input area to write your query in CloudWatch Logs Query Language.
You can also write queries returning time series data by using the stats command.
When making stats queries in Explore, make sure you are in Metrics Explore mode.

Cross-account observability
The CloudWatch plugin provides the ability to monitor and troubleshoot applications that span across multiple accounts within a region. Using cross-account observability, you can seamlessly search, visualize and analyze metrics and logs, without having to worry about account boundaries.
Note: This feature is currently behind the
cloudWatchCrossAccountQueryingfeature toggle.
You can enable feature toggles through configuration file or environment variables. See configuration docs for details. Grafana Cloud users can access this feature by opening a support ticket in the Cloud Portal.
Getting started
To enable cross-account observability, first enable it in CloudWatch using the official CloudWatch docs, then add two new API actions to the IAM policy attached to the role/user running the plugin.
Cross-account querying is available in the plugin through the Logs mode and the Metric search mode. Once you have it configured correctly, you’ll see a “Monitoring account” badge displayed in the query editor header.

Metrics editor
When you select the Builder mode within the Metric search editor, a new Account field displays. Use the Account field to specify which of the linked accounts to target for the given query. By default, the All option is specified, which will target all linked accounts.
While in Code mode, you can specify any math expression. If the Monitoring account badge displays in the query editor header, all SEARCH expressions entered in this field will be cross-account by default. You can limit the search to one or a set of accounts, as documented in the AWS documentation.
Logs editor
The Log group selector allows you to specify what log groups to target in the logs query. If the Monitoring account badge is displayed in the query editor header, it is possible to search and select log groups across multiple accounts. You can use the Account field in the Log Group Selector to filter Log Groups by Account. If you have many log groups and do not see the log group you’d like to select in the selector, use the prefix search to narrow down the possible log groups.
Deep-link Grafana panels to the CloudWatch console

To view your query in the CloudWatch Logs Insights console, click the CloudWatch Logs Insights button next to the query editor.
If you’re not logged in to the CloudWatch console, the link forwards you to the login page.
The provided link is valid for any account, but displays the expected metrics only if you’re logged in to the account that corresponds to the selected data source in Grafana.


