Important: This documentation is about an older version. It's relevant only to the release noted, many of the features and functions have been updated or replaced. Please view the current version.
Share dashboards and panels
Note: Looking for prebuilt Grafana dashboards? Check out our full library of dashboards and more →
Grafana enables you to share dashboards and panels with other users within an organization and in certain situations, publicly on the Web. You can share using:
- A direct link
- A Snapshot
- An embedded link (for panels only)
- An export link (for dashboards only)
You must have an authorized viewer permission to see an image rendered by a direct link.
The same permission is also required to view embedded links unless you have anonymous access permission enabled for your Grafana instance.
Note: As of Grafana 8.0, anonymous access permission is not available in Grafana Cloud.
When you share a panel or dashboard as a snapshot, a snapshot (which is a panel or dashboard at the moment you take the snapshot) is publicly available on the web. Anyone with a link to it can access it. Because snapshots do not require any authorization to view, Grafana removes information related to the account it came from, as well as any sensitive data from the snapshot.
Share a dashboard
You can share a dashboard as a direct link or as a snapshot. You can also export a dashboard.
Note: If you change a dashboard, ensure that you save the changes before sharing.
Navigate to the home page of your Grafana instance.
Click on the share icon in the top navigation.
The share dialog opens and shows the Link tab.
![Dashboard share direct link]()
Share a direct link
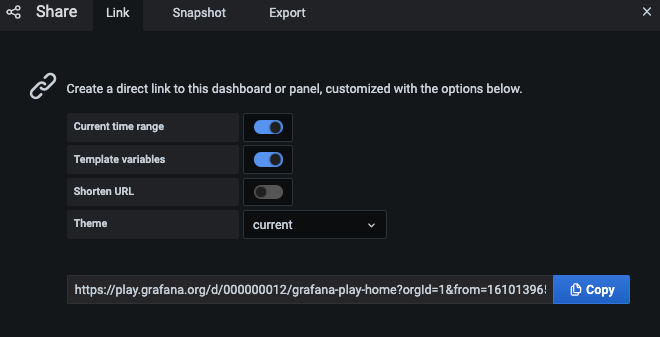
The Link tab shows the current time range, template variables, and the default theme. You can also share a shortened URL.
Click Copy.
This action copies the default or the shortened URL to the clipboard.
Send the copied URL to a Grafana user with authorization to view the link.
Publish a snapshot
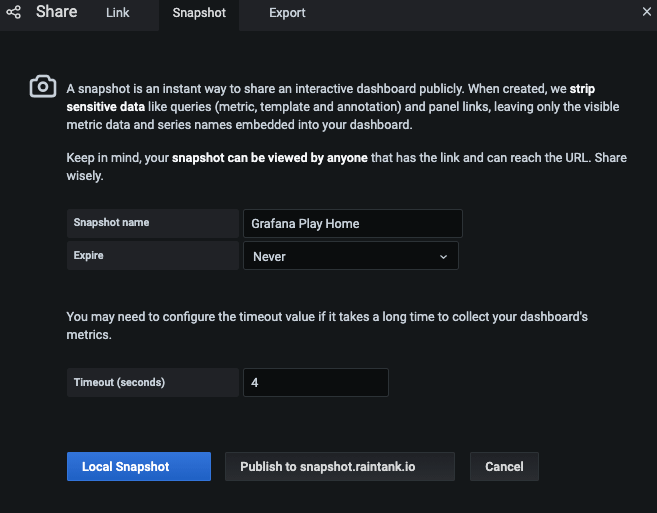
A dashboard snapshot shares an interactive dashboard publicly. Grafana strips sensitive data such as queries (metric, template and annotation) and panel links, leaving only the visible metric data and series names embedded in the dashboard. Dashboard snapshots can be accessed by anyone with the link.
You can publish snapshots to your local instance or to snapshots.raintank.io. The latter is a free service provided by Grafana Labs that enables you to publish dashboard snapshots to an external Grafana instance. Anyone with the link can view it. You can set an expiration time if you want the snapshot removed after a certain time period.

Click Local Snapshot or Publish to snapshots.raintank.io.
Grafana generates a link of the snapshot.
Copy the snapshot link, and share it either within your organization or publicly on the web.
If you created a snapshot by mistake, click Delete snapshot to remove the snapshot from your Grafana instance.
Dashboard export
Grafana dashboards can easily be exported and imported. For more information, refer to Export and import dashboards.

Export dashboard as PDF
You can generate and save PDF files of any dashboard.
Note: Available in Grafana Enterprise.
In the upper-right corner of the dashboard that you want to export as PDF, click the Share dashboard icon.
On the PDF tab, select a layout option for the exported dashboard: Portrait or Landscape.
Click Save as PDF to render the dashboard as a PDF file.
Grafana opens the PDF file in a new window or browser tab.
Share a panel
You can share a panel as a direct link, as a snapshot, or as an embedded link. You can also create library panels using the Share option on any panel.
Click a panel title to open the panel menu.
Click Share.
The share dialog opens and shows the Link tab.
![Panel share direct link]()
Use direct link
The Link tab shows the current time range, template variables, and the default theme. You can optionally enable a shortened URL to share.
Click Copy.
This action copies the default or the shortened URL to the clipboard.
Send the copied URL to a Grafana user with authorization to view the link.
You also optionally click Direct link rendered image to share an image of the panel.
For more information, refer to Image rendering.
The following example shows a link to a server-side rendered PNG:
https://play.grafana.org/d/000000012/grafana-play-home?orgId=1&from=1568719680173&to=1568726880174&panelId=4&fullscreenQuery string parameters for server-side rendered images
- width: Width in pixels. Default is 800.
- height: Height in pixels. Default is 400.
- tz: Timezone in the format
UTC%2BHH%3AMMwhere HH and MM are offset in hours and minutes after UTC - timeout: Number of seconds. The timeout can be increased if the query for the panel needs more than the default 30 seconds.
- scale: Numeric value to configure device scale factor. Default is 1. Use a higher value to produce more detailed images (higher DPI). Supported in Grafana v7.0+.
Publish a snapshot
A panel snapshot shares an interactive panel publicly. Grafana strips sensitive data leaving only the visible metric data and series names embedded in the dashboard. Panel snapshots can be accessed by anyone with the link.
You can publish snapshots to your local instance or to snapshots.raintank.io. The latter is a free service provided by Grafana Labs, that enables you to publish dashboard snapshots to an external Grafana instance. You can optionally set an expiration time if you want the snapshot to be removed after a certain time period.

In the Share Panel dialog, click Snapshot to open the tab.
Click Local Snapshot or Publish to snapshots.raintank.io.
Grafana generates the link of the snapshot.
Copy the snapshot link, and share it either within your organization or publicly on the web.
If you created a snapshot by mistake, click Delete snapshot to remove the snapshot from your Grafana instance.
Embed panel
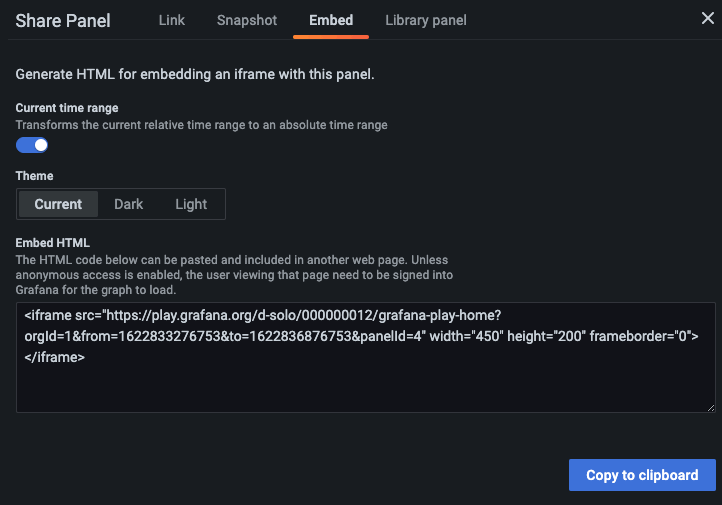
You can embed a panel using an iframe on another web site. A viewer must be signed into Grafana to view the graph.
> Note: As of Grafana 8.0, anonymous access permission is no longer available for Grafana Cloud.

Here is an example of the HTML code:
<iframe
  src="https://snapshots.raintank.io/dashboard-solo/snapshot/y7zwi2bZ7FcoTlB93WN7yWO4aMiz3pZb?from=1493369923321&to=1493377123321&panelId=4"
  width="650"
  height="300"
  frameborder="0"
></iframe>
The result is an interactive Grafana graph embedded in an iframe:
Library panel
To create a library panel from the Share Panel dialog:
- Click Library panel.
![Screenshot of the create library panel dialog Screenshot of the create library panel dialog]()
Screenshot of the create library panel dialog - In Library panel name, enter the name.
- In Save in folder, select the folder in which to save the library panel. By default, the General folder is selected.
- Click Create library panel to save your changes.
- Save the dashboard.


