Important: This documentation is about an older version. It's relevant only to the release noted, many of the features and functions have been updated or replaced. Please view the current version.
What’s new in Grafana v6.4
For all details please read the full CHANGELOG.md.
Highlights
Grafana 6.4 comes with a lot of new features and enhancements backed with tons of work around the data models and query execution that is going to enable powerful future capabilities. Some of those new capabilities can already be seen in this release, like sharing query results between panels.
- Explore: Go back to dashboard (with query changes)
- Explore: Live tailing improvements
- Loki: Show logs as annotations in dashboard graphs
- Loki: Use Loki in dashboard panels
- Panels: New logs panel
- Panels: Data links improvements
- [Graph: Series override to turn constant (point) into a line](#series-override-to turn-constant-into-a-line)
- Dashboard: Share query results between panels
- Plugins: Alpha version of grafana-toolkit
- Image Rendering: PhantomJS deprecation
- Docker: Alpine based docker image
- LDAP: Debug UI
- Enterprise: Reporting
- Enterprise: GitLab OAuth Team Sync support
- Enterprise: Teams and LDAP Improvements
Go back to dashboard from Explore
To help accelerate workflows that involve regularly switching from Explore to a dashboard and vice-versa, we’ve added the ability to return to the origin dashboard after navigating to Explore from the panel’s dropdown.
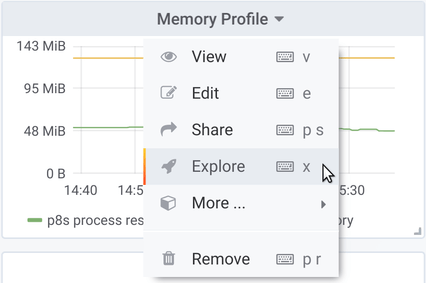
After you’ve navigated to Explore, you should notice a “Back” button in the Explore toolbar.

Simply clicking the button will return you to the origin dashboard, or, if you’d like to bring changes you make in Explore back to the dashboard, simply click the arrow next to the button to reveal a “Return to panel with changes” menu item.

Live tailing improvements
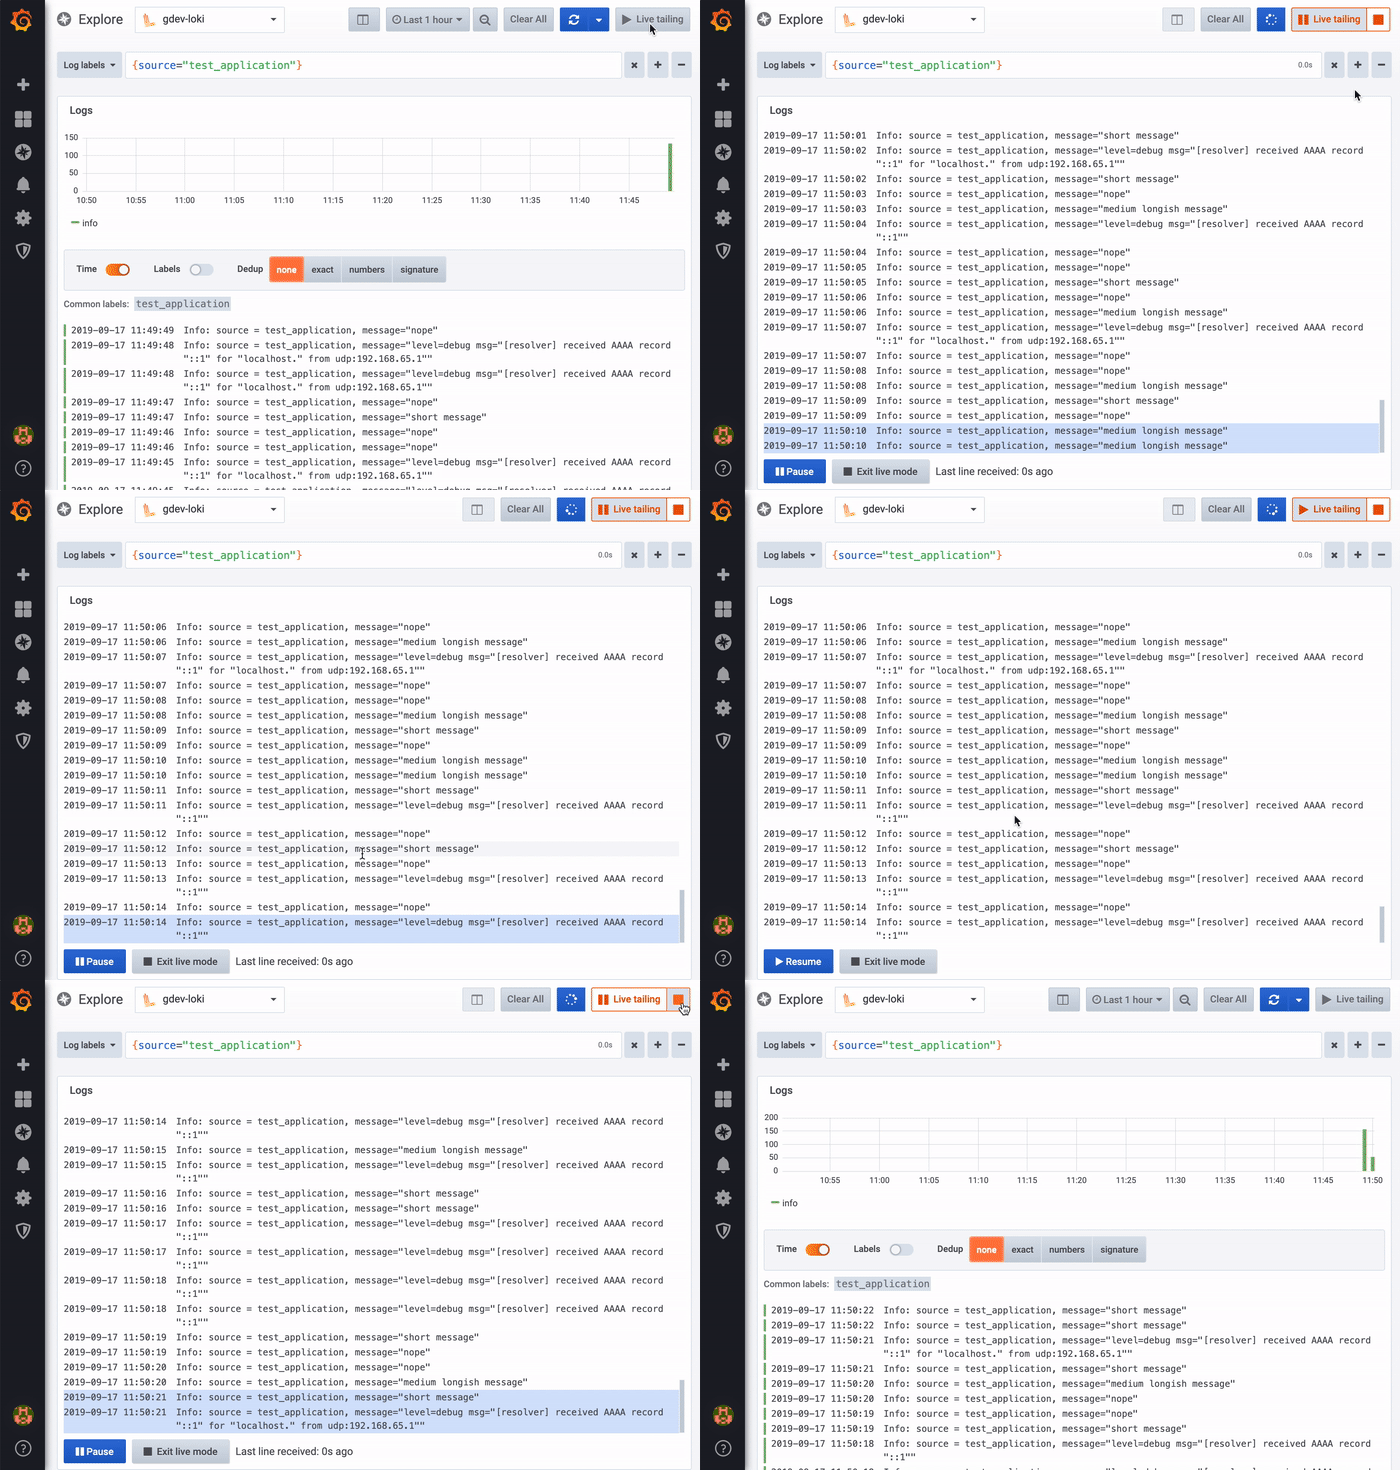
With 6.4 version you can now pause the live tail view to see the last 1000 lines of logs without being interrupted by new logs coming in. You can either pause manually with pause button or the live tailing will automatically pause when you scroll up to see older logs. To resume you just hit the resume button to continue live tailing.
We also introduced some performance optimizations to allow live tailing of higher throughput log streams and various UI fixes and improvements like more consistent styling and fresh logs highlighting.
New Logs Panel
The logs panel shows log lines from datasources that support logs, e.g., Elastic, Influx, and Loki. Typically you would use this panel next to a graph panel to display the log output of a related process.
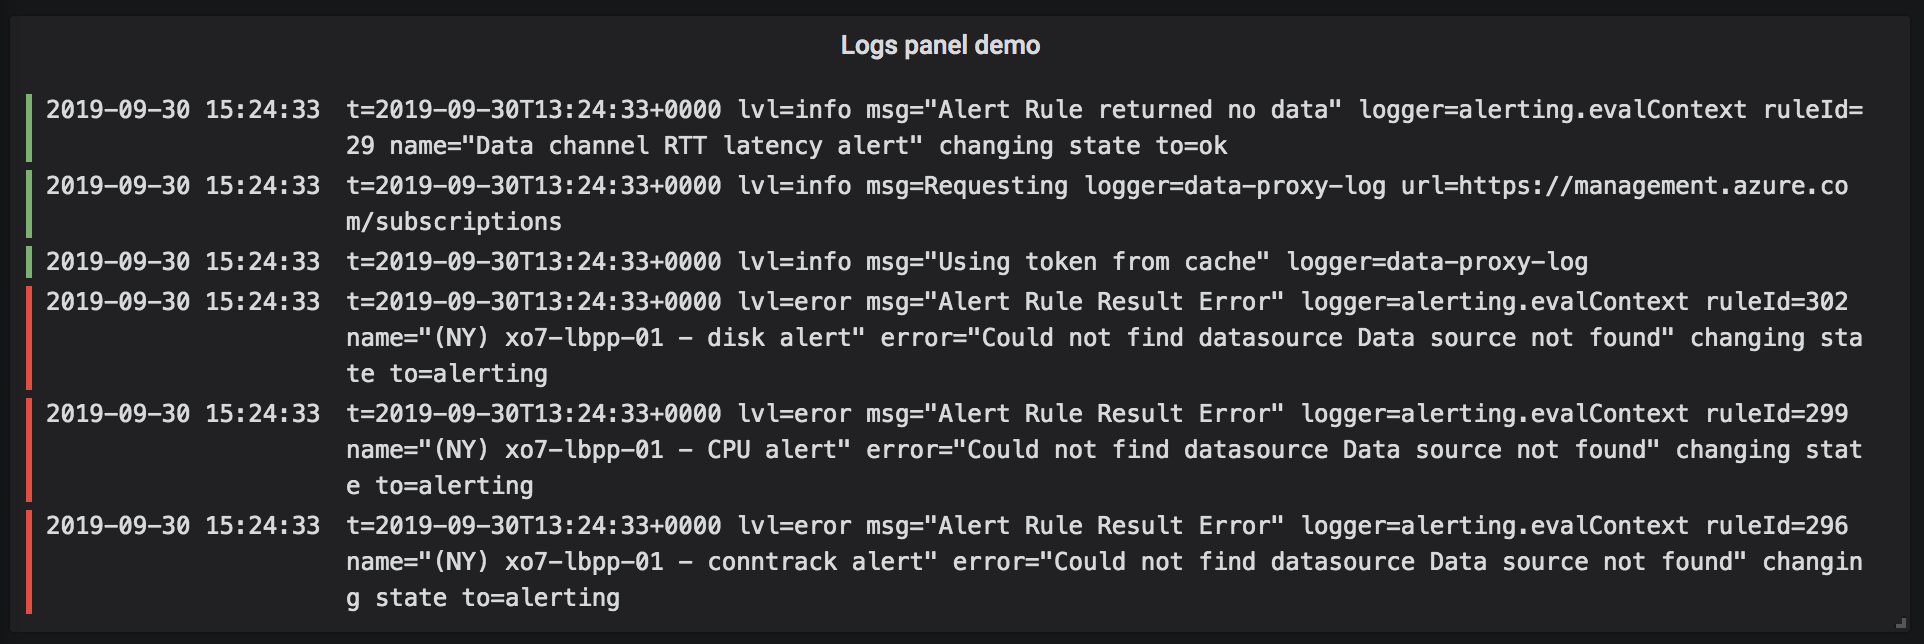
Limitations: Even though Live tailing can be enabled on logs panels in dashboards, we recommend using Live tailing in Explore. On dashboards, the refresher at the top of the page should be used instead to keep the data of all panels in sync. Note that the logs panel is still beta and we’re looking to get feedback.
Data Links improvements
With Grafana 6.3 we introduced a new way of creating Data Links. Grafana 6.4 improves Data Links and adds them to the Gauge and Bar Gauge and panels.
With Data Links you can define dynamic links to other dashboards and systems. The link can now reference template variables and query results like series name and labels, field name, value and time.
For more information about Data Links, refer to data link
Series override to turn constant into a line
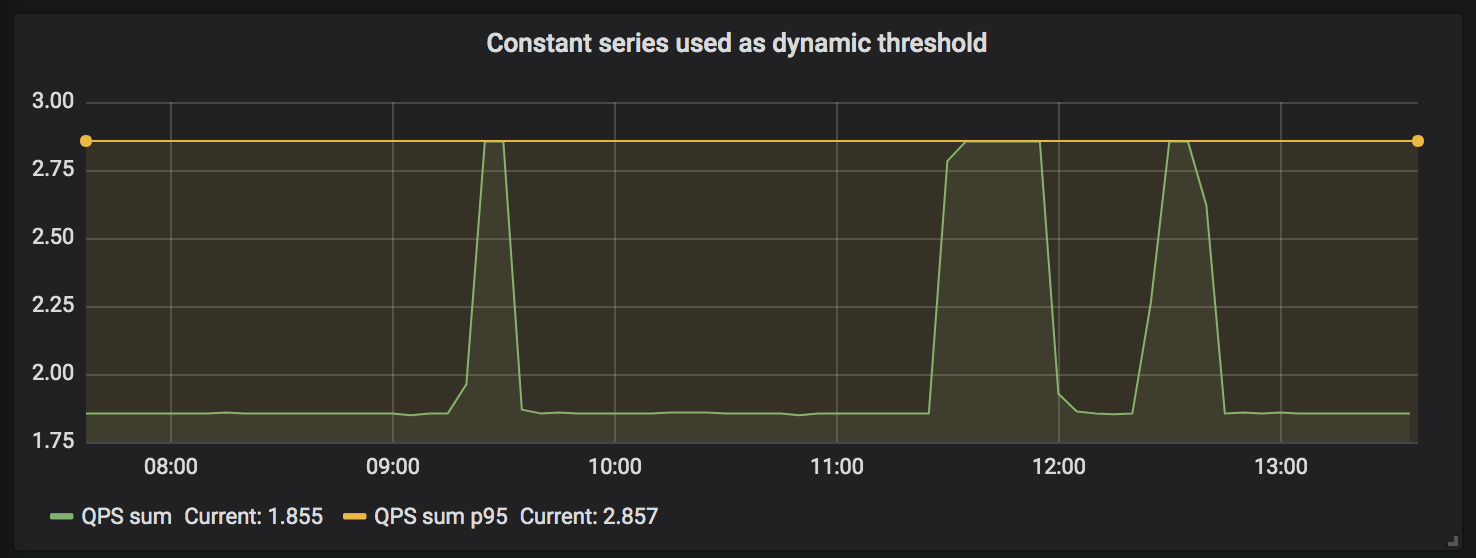
Some graph query results are made up only of one datapoint per series but can be shown in the graph panel with the help of series overrides.
To show a horizontal line through the Y-value of the datapoint across the whole graph, add a series override and select Transform > constant.
Share query results between panels
Grafana 6.4 continues the work started in 6.3 of creating a data model and query execution lifecycle that can support robust analytics and streaming. These changes are mostly structural and lay the foundation for powerful features in future releases.
The first new feature all these changes have enabled is the ability to share query results between panels. So for example if you have an expensive query you can visualize the same results in a graph, table and singlestat panel. To reuse another panel’s query result select the data source named -- Dashboard -- and then select the panel.
To make the sharing of query results even more powerful we are introducing a transformation step as well that allows you to select specific parts of the query result and transform it. This new transformation feature is in alpha state and has to be enabled in the config file.
DataFrame, our primary data model, has now a columnar layout. This
will support easier frontend processing. The DataSource query interface has been updated to better support streaming.
The result can now either return a Promise<result> or Observable<result>. Be on the lookout for more on live data
streaming in the future!
Alpha version of grafana-toolkit
grafana-toolkit is our attempt to simplify the life of plugin developers. It’s a CLI that helps them focus on the core value of their plugin rather than the ceremony around setting up the environment, configs, tests and builds. It’s available as an NPM package under next tag.
You can read more about the grafana-toolkit in the Readme and play with it by trying out our react panel or angular panel templates.
PhantomJS deprecation
PhantomJS, which is used for rendering images of dashboards and panels, have been deprecated and will be removed in a future Grafana release. A deprecation warning will from now on be logged when Grafana starts up if PhantomJS is in use.
Please consider migrating from PhantomJS to the Grafana Image Renderer plugin.
Alpine-based Docker image
Grafana’s Docker image is now based on Alpine 3.10 and should from now on report zero vulnerabilities when scanning the image for security vulnerabilities.
LDAP Debug UI
After listening to customer feedback, we have been working at improving the experience to set up authentication and synchronization with LDAP. We’re happy to present the new LDAP Debug View.
You’ll be able to see how a user authenticating with LDAP would be mapped and whether your LDAP integration is working correctly. Furthermore, it provides a simpler method to test your integration with LDAP server(s) and have a clear view of how attributes are mapped between both systems.
The feature is currently limited to Grafana Server Admins.
For more information on how to use this new feature, follow the guide.
Grafana Enterprise
Reporting
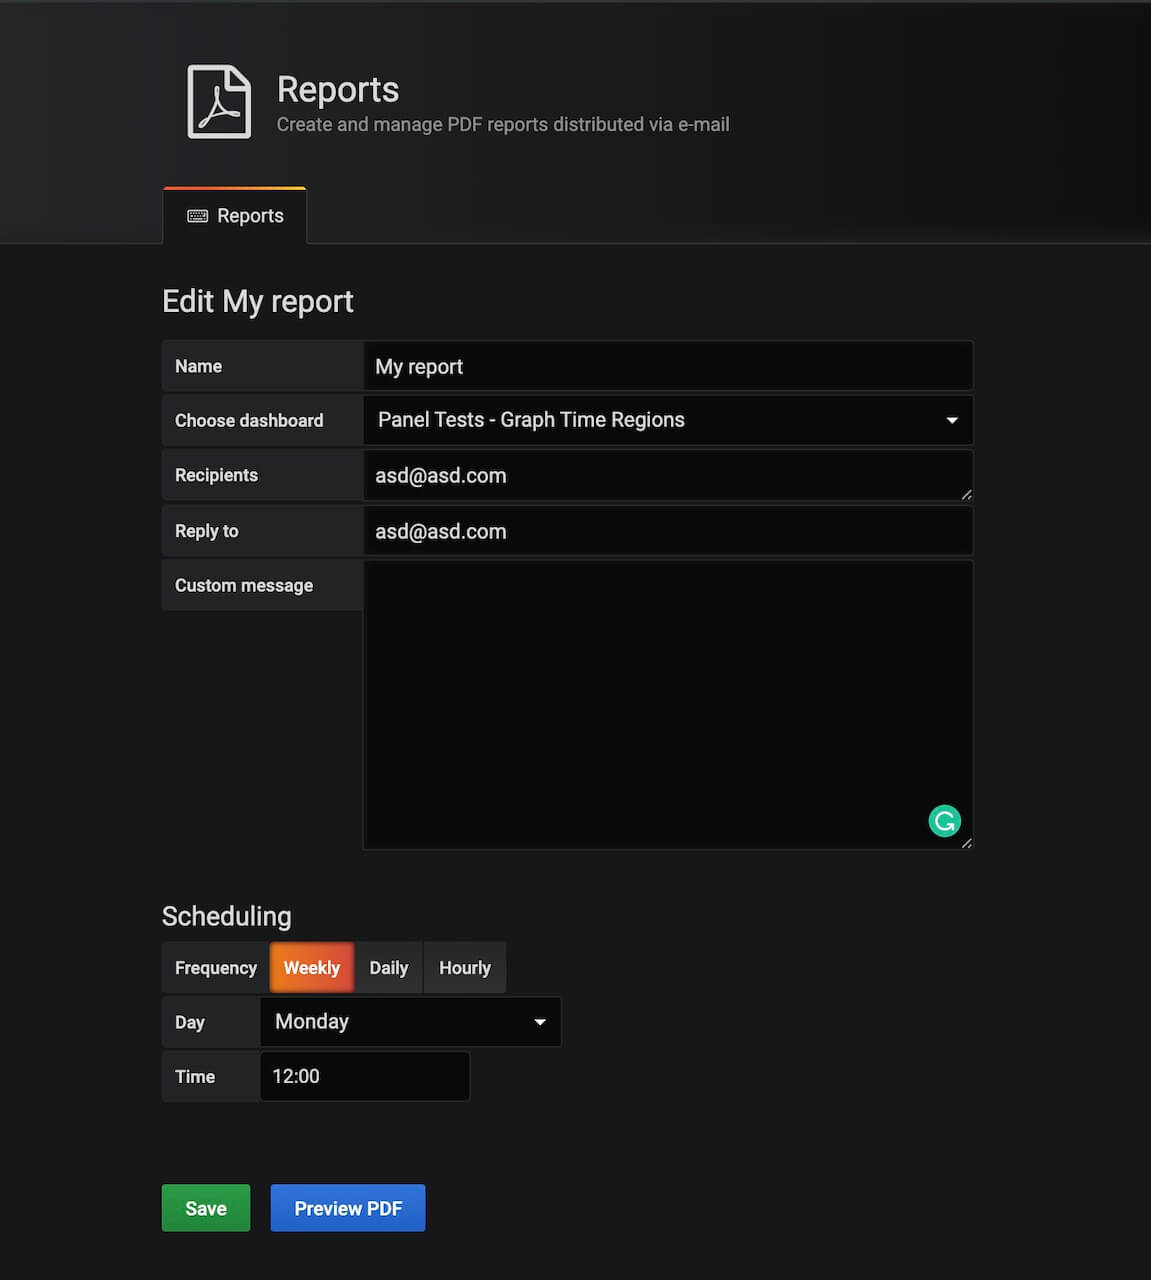
A common request from Enterprise users have been to be able to set up reporting for Grafana, and now it’s here. A report is simply a PDF of a Grafana dashboard, outside of just generating a PDF you can set up a schedule so that you can get the report emailed to yourself (or whoever is interested) whenever it suits you.
This feature is currently limited to Organization Admins.
GitLab OAuth Team Sync support
GitLab OAuth gets support for Team Sync, making it possible to synchronize your GitLab Groups with Teams in Grafana.
Upgrading
See upgrade notes.
Changelog
Check out the CHANGELOG.md file for a complete list of new features, changes, and bug fixes.


