Important: This documentation is about an older version. It's relevant only to the release noted, many of the features and functions have been updated or replaced. Please view the current version.
What’s new in Grafana v6.2
For all details please read the full CHANGELOG.md.
If you use a password for your data sources please read the upgrade notes.
Check out the demo dashboard of some the new features in v6.2.
Improved security
Data sources now store passwords and basic auth passwords in secureJsonData encrypted by default. Existing data source with unencrypted passwords will keep working.
Read the upgrade notes on how to migrate existing data sources to use encrypted storage.
To mitigate the risk of Clickjacking, embedding Grafana is no longer allowed per default. Read the upgrade notes for further details of how this may affect you.
To mitigate the risk of sensitive information being cached in browser after a user has logged out, browser caching is now disabled for full page requests.
Provisioning
- Environment variables support, see Using environment variables for more information.
- Reload provisioning configs, see Admin HTTP API for more information.
- Do not allow deletion of provisioned dashboards
- When trying to delete or save provisioned dashboard, relative file path to the file is shown in the dialog.
Official support for Elasticsearch 7
Grafana v6.2 ships with official support for Elasticsearch v7, see Using Elasticsearch in Grafana for more information.
Bar Gauge Panel
Grafana v6.2 ships with a new exciting panel! This new panel, named Bar Gauge, is very similar to the current Gauge panel and shares almost all it’s options. The main difference is that the Bar Gauge uses both horizontal and vertical space much better and can be more efficiently stacked both vertically and horizontally. The Bar Gauge also comes with 3 unique display modes, Basic, Gradient, and Retro LED. Read the preview article to learn more about the design and features of this new panel.
Retro LED display mode
Gradient mode
Improved table data support
We have been working on improving table support in our new react panels (Gauge and Bar Gauge) and this is ongoing work that will eventually come to the new Graph and Singlestat and Table panels we are working on. But you can see it already in the Gauge and Bar Gauge panels. Without any config, you can visualize any number of columns or choose to visualize each row as its own gauge.
Lazy loading of panels out of view
This has been one of the most requested features for many years and is now finally here! Lazy loading of panels means Grafana will not issue any data queries for panels that are not visible. This will greatly reduce the load on your data source backends when loading dashboards with many panels.
Panels without title
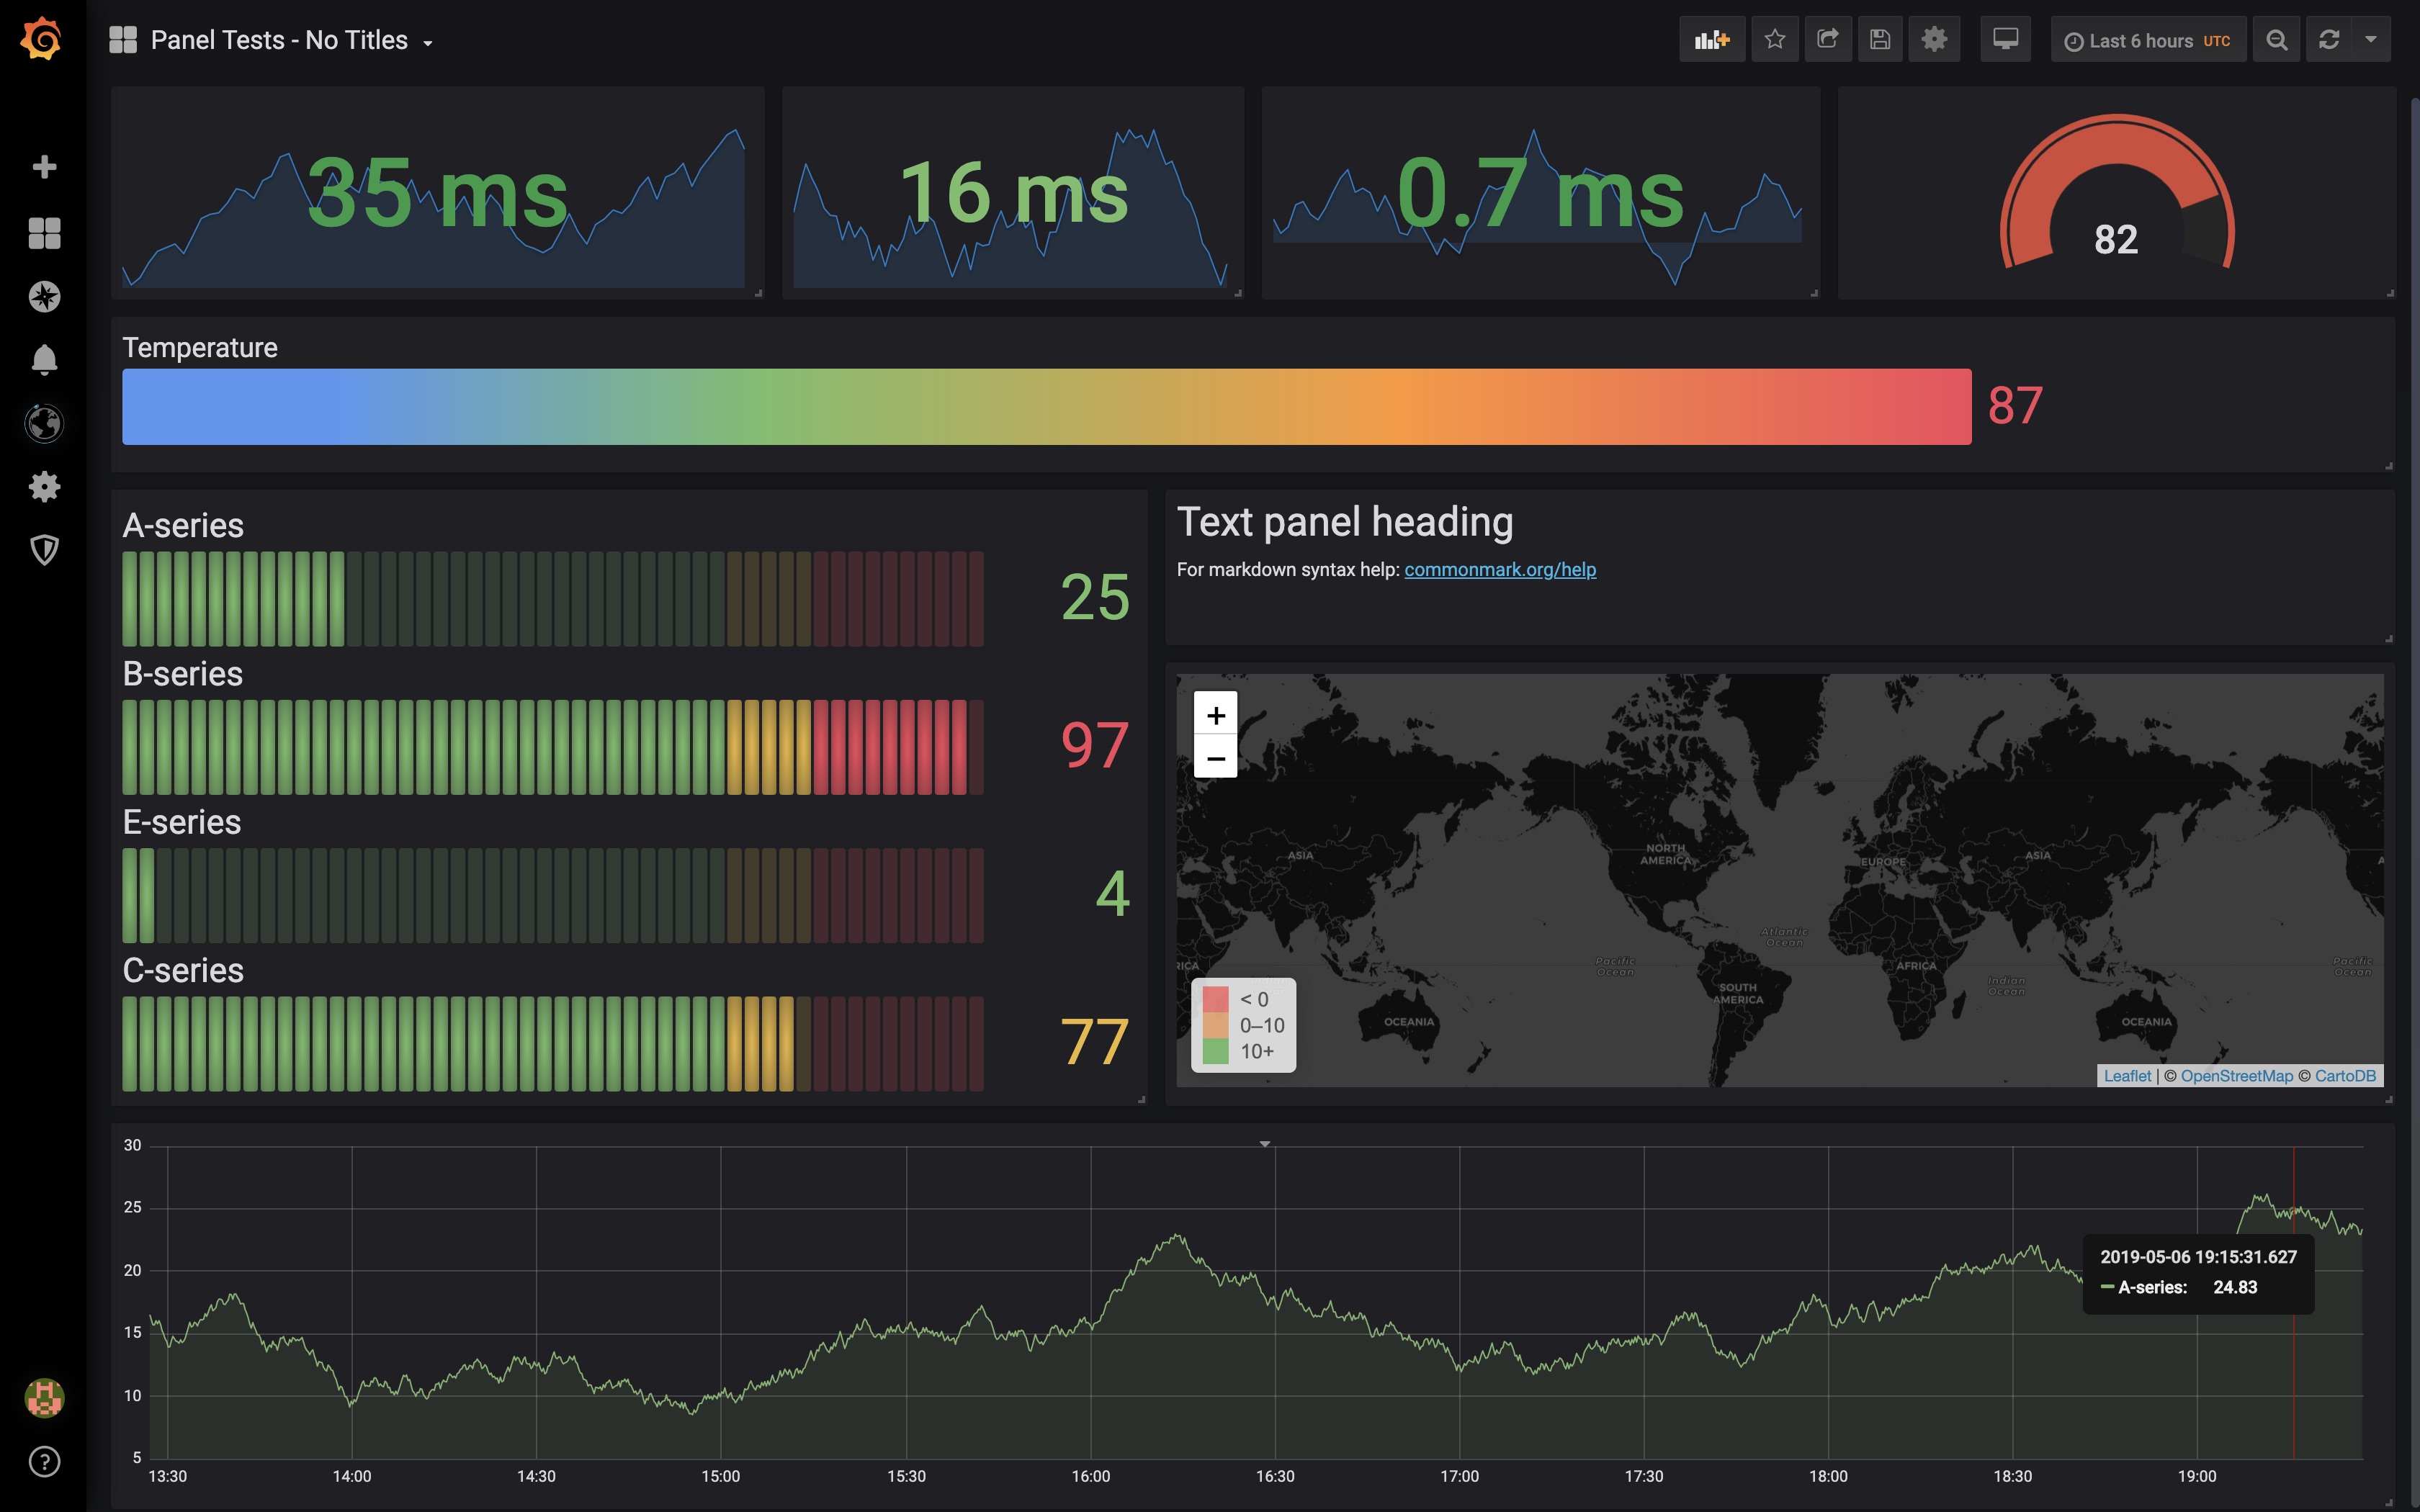
Sometimes your panels do not need a title and having that panel header still take up space makes singlestats and other panels look strange and have bad vertical centering. In v6.2 Grafana will allow panel content (visualizations) to use the full panel height in case there is no panel title.

Minor Features and Fixes
This release contains a lot of small features and fixes:
- Explore - Adds user time zone support, reconnect for failing data sources and a fix that prevents killing Prometheus instances when Histogram metrics are loaded.
- Alerting - Adds support for configuring timeout durations and retries, see configuration for more information.
- Azure Monitor - Adds support for multiple subscriptions per data source.
- Elasticsearch - A small bug fix to properly display percentiles metrics in table panel.
- InfluxDB - Support for POST HTTP verb.
- CloudWatch - Important fix for default alias disappearing in v6.1.
- Search - Works in a scope of dashboard’s folder by default when viewing dashboard.
Check out the CHANGELOG.md file for a complete list of new features, changes, and bug fixes.
A huge thanks to our community for all the reported issues, bug fixes and feedback.
Upgrading
Read important upgrade notes.


