Important: This documentation is about an older version. It's relevant only to the release noted, many of the features and functions have been updated or replaced. Please view the current version.
Azure Monitor data source
Grafana includes built-in support for Azure Monitor, the Azure service to maximize the availability and performance of your applications and services in the Azure Cloud. The Azure Monitor data source supports visualizing data from three Azure services:
- Azure Monitor Metrics to collect numeric data from resources in your Azure account.
- Azure Monitor Logs to collect log and performance data from your Azure account, and query using the powerful Kusto Language.
- Azure Resource Graph to quickly query your Azure resources across subscriptions.
This topic explains configuring, querying, and other options specific to the Azure Monitor data source. Refer to Add a data source for instructions on how to add a data source to Grafana.
Azure Monitor configuration
To access Azure Monitor configuration, hover your mouse over the Configuration (gear) icon, click Data Sources, and then select the Azure Monitor data source. If you haven’t already, you’ll need to add the Azure Monitor data source.
You must create an app registration and service principal in Azure AD to authenticate the data source. See the Azure documentation for configuration details. Alternatively, if you are hosting Grafana in Azure (e.g. App Service, or Azure Virtual Machines) you can configure the Azure Monitor data source to use Managed Identity to securely authenticate without entering credentials into Grafana. Refer to Configuring using Managed Identity for more details.
Azure Monitor query editor
The Azure Monitor data source has three different modes depending on which Azure service you wish to query:
- Metrics for Azure Monitor Metrics
- Logs for Azure Monitor Logs
- Azure Resource Graph
Querying Azure Monitor Metrics
Azure Monitor Metrics collects numeric data from supported resources and allows you to query them to investigate the health and utilization of your resources to maximise availability and performance.
Metrics are a lightweight format that only stores simple numeric data in a particular structure. Metrics is capable for supporting near real-time scenarios making it useful for fast detection of issues. Azure Monitor Logs can store a variety of different data types each with their own structure.
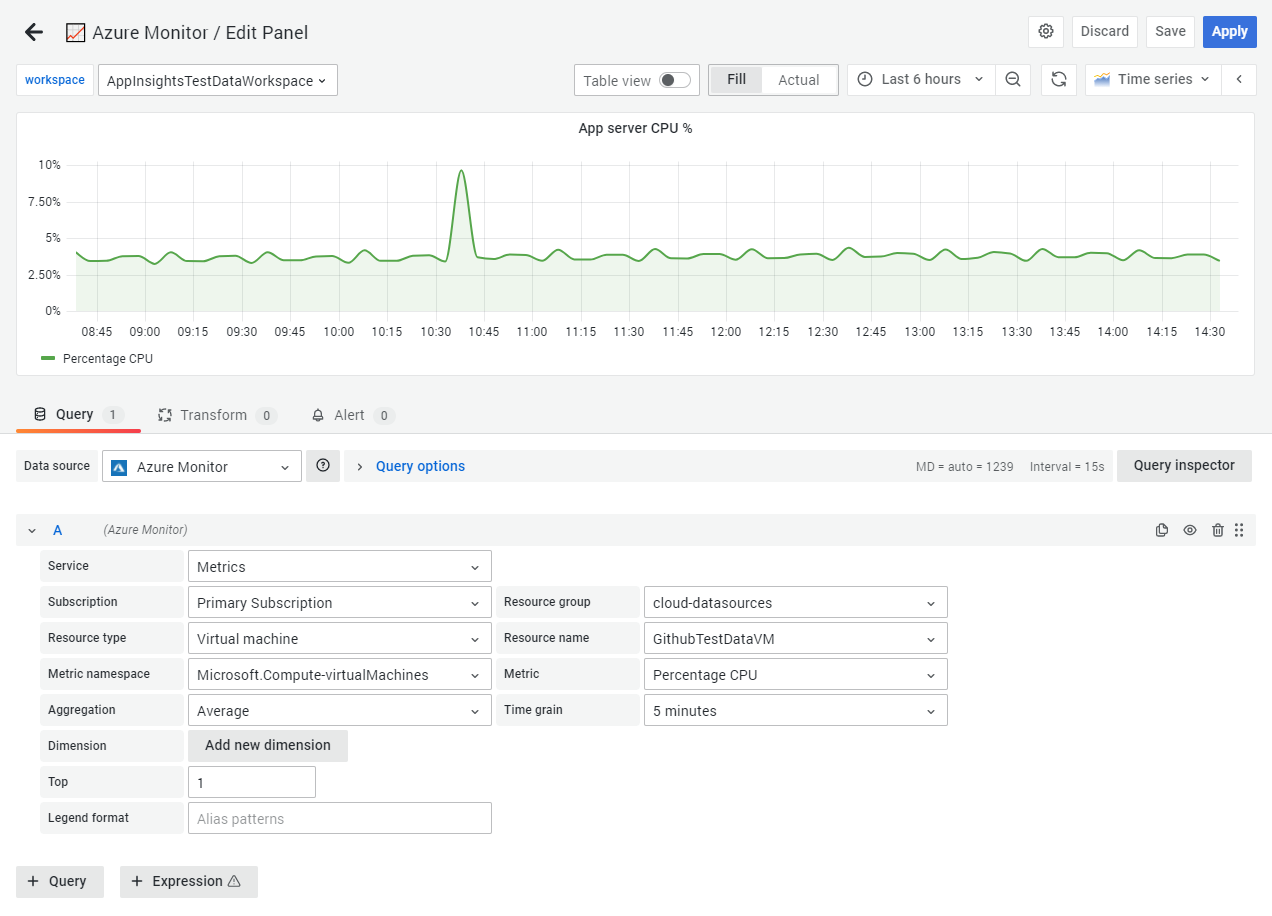
Your first Azure Monitor Metrics query
- Select the Metrics service
- Select a resource to pull metrics from using the subscription, resource group, resource type, and resource fields.
- Some resources, such as storage accounts, organise metrics under multiple metric namespaces. Grafana will pick a default namespace, but change this to see which other metrics are available.
- Select a metric from the Metric field.
Optionally, you can apply further aggregations or filter by dimensions for further analysis.
- Change the aggregation from the default average to show minimum, maximum or total values.
- Set a specific custom time grain. By default Grafana will automatically select a time grain interval based on your selected time range.
- For metrics that have multiple dimensions, you can split and filter further the returned metrics. For example, the Application Insights dependency calls metric supports returning multiple time series for successful vs unsuccessful calls.
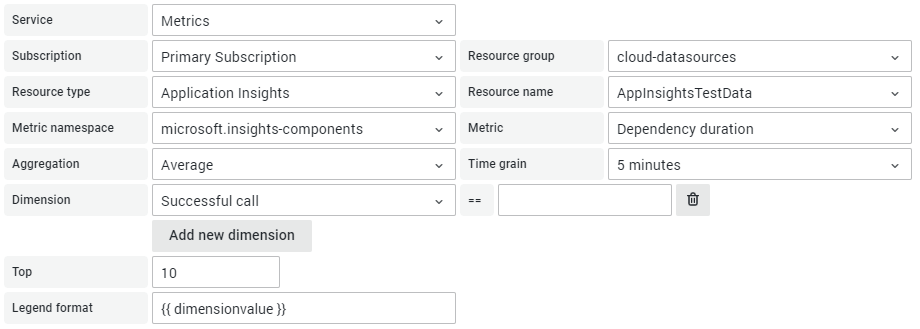
The options available will change depending on what is most relevant to the selected metric.
Legend alias formatting
The legend label for Metrics can be changed using aliases. In the Legend Format field, you can combine aliases defined below any way you want e.g
Blob Type: {{ blobtype }}becomesBlob Type: PageBlob,Blob Type: BlockBlob{{ resourcegroup }} - {{ resourcename }}becomesproduction - web_server
Supported Azure Monitor metrics
Not all metrics returned by the Azure Monitor Metrics API have values. To make it easier for you when building a query, the Grafana data source has a list of supported metrics and ignores metrics which will never have values. This list is updated regularly as new services and metrics are added to the Azure cloud. For more information about the list of metrics, refer to current supported namespaces.
Querying Azure Monitor Logs
Azure Monitor Logs collects and organises log and performance data from supported resources and makes many sources of data available to query together with the sophisticated Kusto Query Language (KQL).
While Azure Monitor Metrics only stores simplified numerical data, Logs can store different data types each with their own structure and can perform complexe analysis of data using KQL.
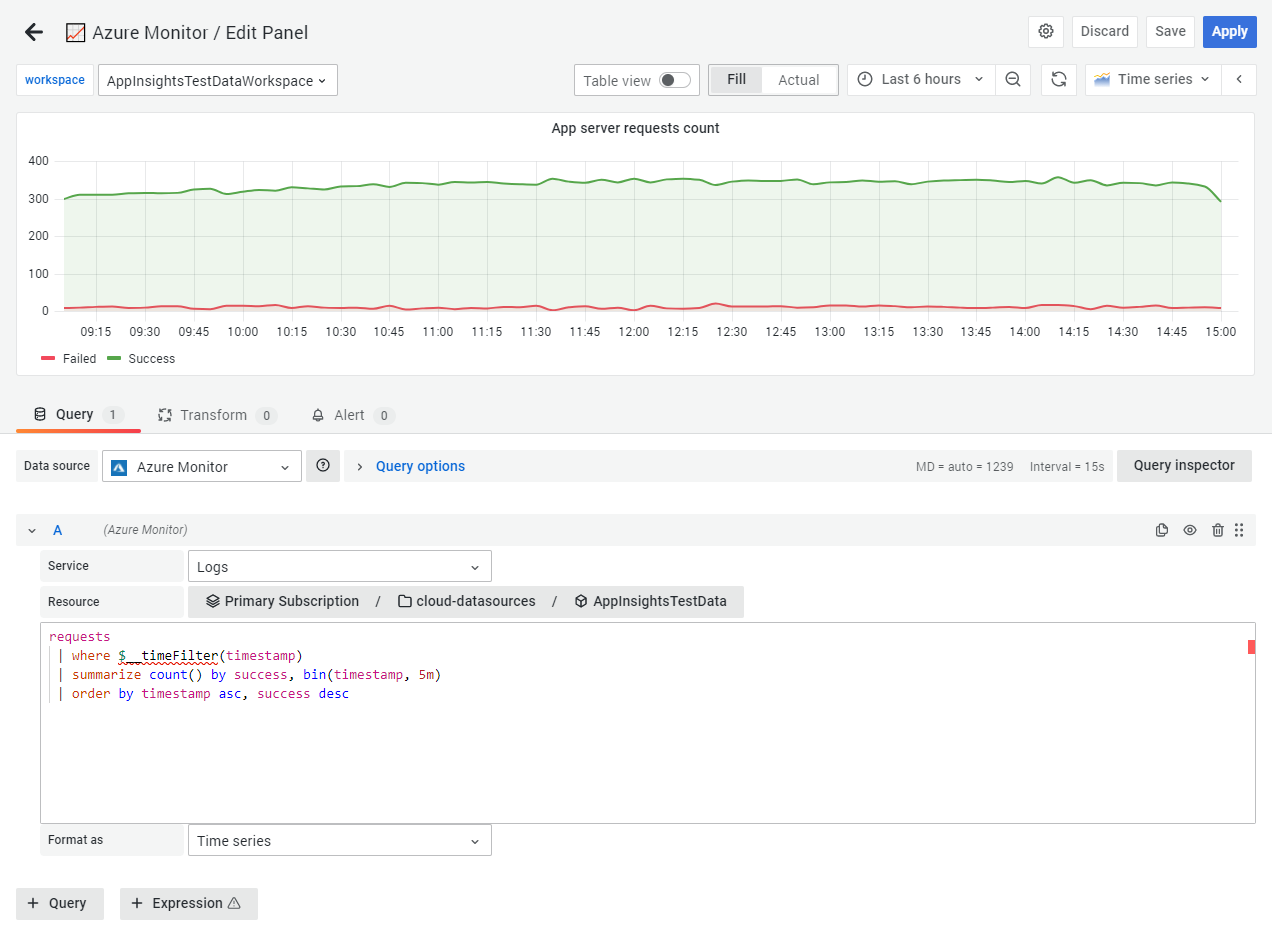
Your first Azure Monitor Logs query
- Select the Logs service
- Select a resource to query. Alternatively, you can dynamically query all resources under a single resource group or subscription.
- Enter in your KQL query. See below for examples.
Kusto Query Language
Azure Monitor Logs queries are written using the Kusto Query Language (KQL), a rich language designed to be easy to read and write, which should be familiar to those know who SQL. The Azure documentation has plenty of resource to help with learning KQL:
- Log queries in Azure Monitor
- Getting started with Kusto
- Tutorial: Use Kusto queries in Azure Monitor
- SQL to Kusto cheat sheet
Here is an example query that returns a virtual machine’s CPU performance, averaged over 5m time grains
Perf
# $__timeFilter is a special Grafana macro that filters the results to the time span of the dashboard
| where $__timeFilter(TimeGenerated)
| where CounterName == "% Processor Time"
| summarize avg(CounterValue) by bin(TimeGenerated, 5m), Computer
| order by TimeGenerated asc
Time series queries are for values that change over time, usually for graph visualisations such as the Time series panel. Each query should return at least a datetime column and a numeric value column. The result must also be sorted in ascending order by the datetime column.
A query can also have one or more non-numeric/non-datetime columns, and those columns are considered dimensions and become labels in the response. For example, a query that returns the aggregated count grouped by hour, Computer, and the CounterName:
Perf
| where $__timeFilter(TimeGenerated)
| summarize count() by bin(TimeGenerated, 1h), Computer, CounterName
| order by TimeGenerated asc
You can also select additional number value columns (with, or without multiple dimensions). For example, getting a count and average value by hour, Computer, CounterName, and InstanceName:
Perf
| where $__timeFilter(TimeGenerated)
| summarize Samples=count(), ["Avg Value"]=avg(CounterValue)
    by bin(TimeGenerated, $__interval), Computer, CounterName, InstanceName
| order by TimeGenerated asc
Table queries are mainly used in the Table panel and show a list of columns and rows. This example query returns rows with the six specified columns:
AzureActivity
| where $__timeFilter()
| project TimeGenerated, ResourceGroup, Category, OperationName, ActivityStatus, Caller
| order by TimeGenerated desc
Logs macros
To make writing queries easier there are several Grafana macros that can be used in the where clause of a query:
Additionally, Grafana has the built-in $__interval macro
Querying Azure Resource Graph
Azure Resource Graph (ARG) is a service in Azure that is designed to extend Azure Resource Management by providing efficient and performant resource exploration, with the ability to query at scale across a given set of subscriptions so that you can effectively govern your environment. By querying ARG, you can query resources with complex filtering, iteratively explore resources based on governance requirements, and assess the impact of applying policies in a vast cloud environment.
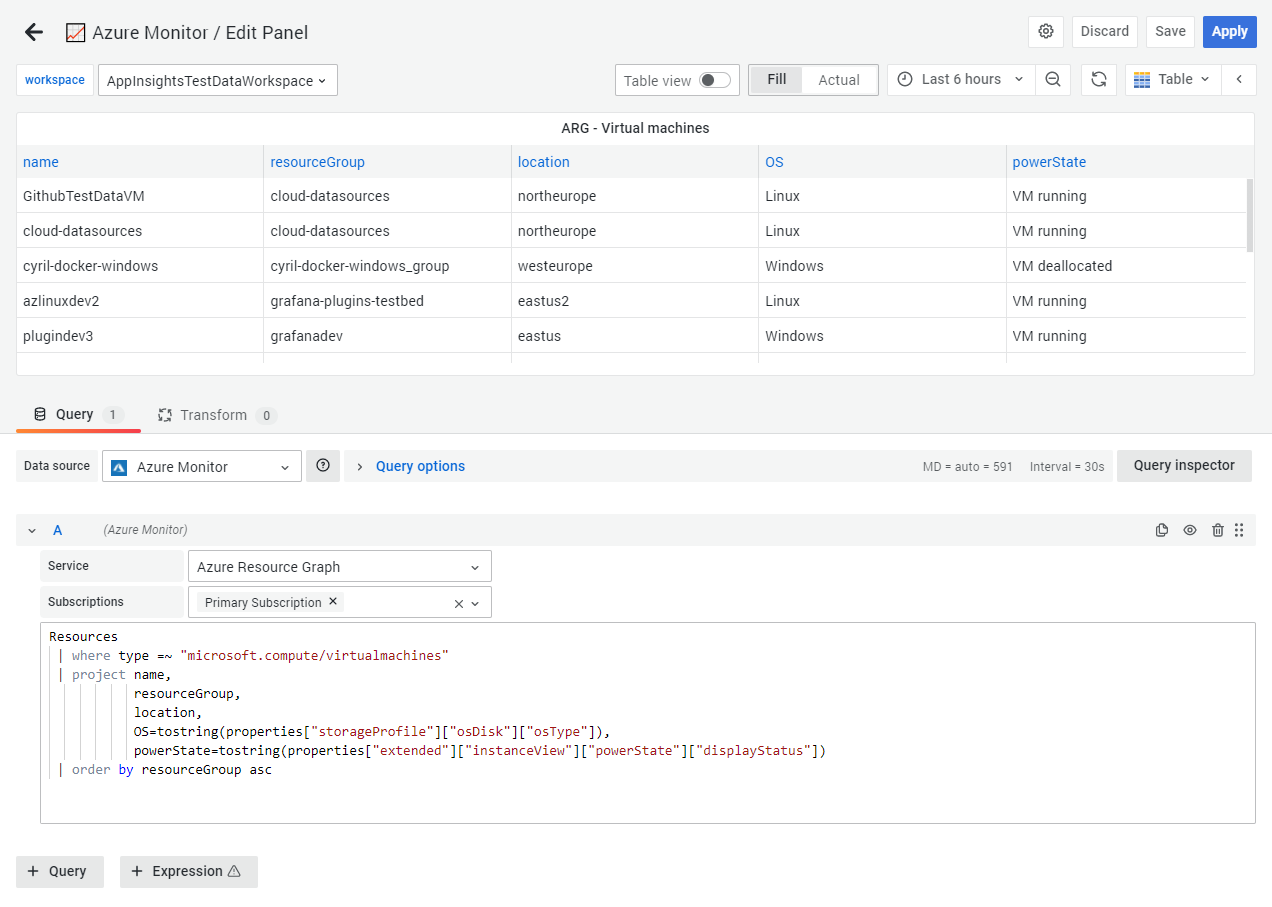
Your first Azure Resource Graph query
ARG queries are written in a variant of the Kusto Query Language, but not all Kusto language features are available in ARG. An Azure Resource Graph query is formatted as table data.
If your credentials give you access to multiple subscriptions, then you can choose multiple subscriptions before entering queries.
Sort results by resource properties
Here is an example query that returns all resources in the selected subscriptions, but only the name, type, and location properties:
Resources
| project name, type, location
| order by name asc
The query uses order by to sort the properties by the name property in ascending (asc) order. You can change what property to sort by and the order (asc or desc). The query uses project to show only the listed properties in the results. You can add or remove properties.
Query resources with complex filtering
Filtering for Azure resources with a tag name of environment that have a value of Internal. You can change these to any desired tag key and value. The =~ in the type match tells Resource Graph to be case insensitive. You can project by other properties or add/remove more.
For example, a query that returns a list of resources with an environment tag value of Internal:
Resources
| where tags.environment=~'internal'
| project name
Group and aggregate the values by property
You can also use summarize and count to define how to group and aggregate the values by property. For example, returning count of healthy, unhealthy, and not applicable resources per recommendation:
securityresources
| where type == 'microsoft.security/assessments'
| extend resourceId=id,
    recommendationId=name,
    resourceType=type,
    recommendationName=properties.displayName,
    source=properties.resourceDetails.Source,
    recommendationState=properties.status.code,
    description=properties.metadata.description,
    assessmentType=properties.metadata.assessmentType,
    remediationDescription=properties.metadata.remediationDescription,
    policyDefinitionId=properties.metadata.policyDefinitionId,
    implementationEffort=properties.metadata.implementationEffort,
    recommendationSeverity=properties.metadata.severity,
    category=properties.metadata.categories,
    userImpact=properties.metadata.userImpact,
    threats=properties.metadata.threats,
    portalLink=properties.links.azurePortal
| summarize numberOfResources=count(resourceId) by tostring(recommendationName), tostring(recommendationState)
In Azure Resource Graph many nested properties (properties.displayName) are of a dynamic type, and should be cast to a string with tostring() to operate on them.
The Azure documentation also hosts many sample queries to help you get started
Azure Resource Graph macros
You can use Grafana macros when constructing a query. Use the macros in the where clause of a query:
$__timeFilter()- Expands totimestamp ≥ datetime(2018-06-05T18:09:58.907Z) andtimestamp ≤ datetime(2018-06-05T20:09:58.907Z)where the from and to datetimes are from the Grafana time picker.$__timeFilter(datetimeColumn)- Expands todatetimeColumn ≥ datetime(2018-06-05T18:09:58.907Z) anddatetimeColumn ≤ datetime(2018-06-05T20:09:58.907Z)where the from and to datetimes are from the Grafana time picker.$__timeFrom()- Returns the From datetime from the Grafana picker. Example:datetime(2018-06-05T18:09:58.907Z).$__timeTo()- Returns the To datetime from the Grafana picker. Example:datetime(2018-06-05T20:09:58.907Z).$__escapeMulti($myVar)- Use with multi-value template variables that contain illegal characters. If$myVarhas the two values as a string'\\grafana-vm\Network(eth0)\Total','\\hello!', then it expands to:@'\\grafana-vm\Network(eth0)\Total', @'\\hello!'. If you are using single value variables, then there is no need for this macro, simply escape the variable inline instead -@'\$myVar'.$__contains(colName, $myVar)- Use with multi-value template variables. If$myVarhas the value'value1','value2', the it expands to:colName in ('value1','value2').If using the
Alloption, then check theInclude All Optioncheckbox and in theCustom all valuefield type in the following value:all. If$myVarhas valueallthen the macro will instead expand to1 == 1. For template variables with a lot of options, this will increase the query performance by not building a large “where..in” clause.
Going further with Azure Monitor
See the following topics to learn more about the Azure Monitor data source:
- Azure Monitor template variables for more interactive, dynamic, and reusable dashboards.
- Provisioning Azure Monitor for configuring the Azure Monitor data source using YAML files
- Deprecating Application Insights and migrating to Metrics and Logs queries
Configuring using Managed Identity
Customers who host Grafana in Azure (e.g. App Service, Azure Virtual Machines) and have managed identity enabled on their VM, will now be able to use the managed identity to configure Azure Monitor in Grafana. This will simplify the data source configuration, requiring the data source to be securely authenticated without having to manually configure credentials via Azure AD App Registrations for each data source. For more details on Azure managed identities, refer to the Azure documentation.
To enable managed identity for Grafana, set the managed_identity_enabled flag in the [azure] section of the Grafana server config.
[azure]
managed_identity_enabled = true
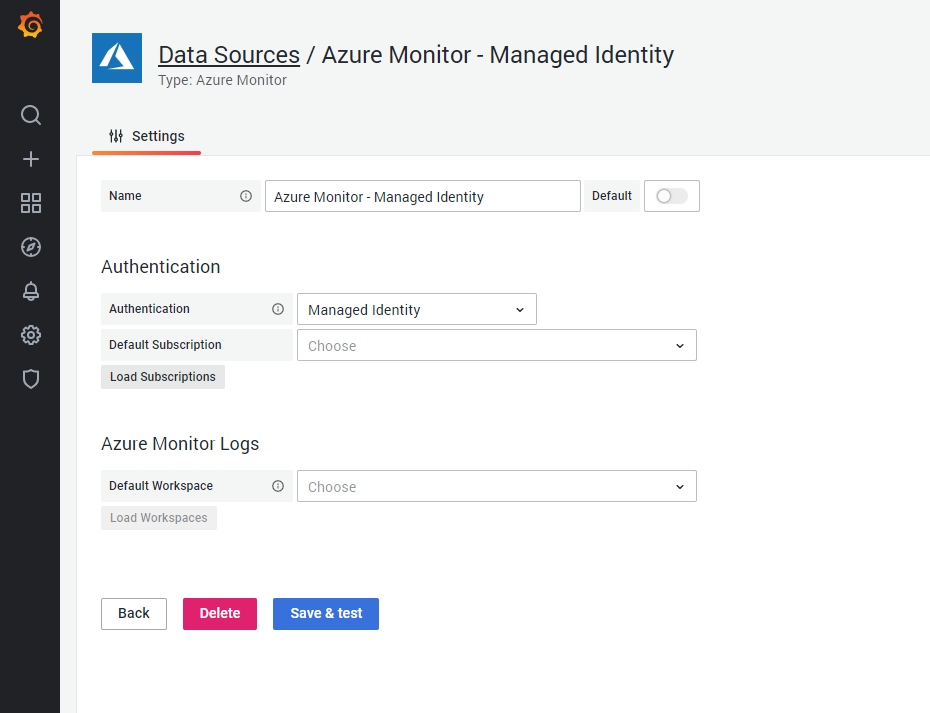
Then, in the Azure Monitor data source configuration and set Authentication to Managed Identity. The directory ID, application ID and client secret fields will be hidden and the data source will use managed identity for authenticating to Azure Monitor Metrics, Logs, and Azure Resource Graph.
