
Menu
Important: This documentation is about an older version. It's relevant only to the release noted, many of the features and functions have been updated or replaced. Please view the current version.
Enterprise
Open source
Dashboard list panel
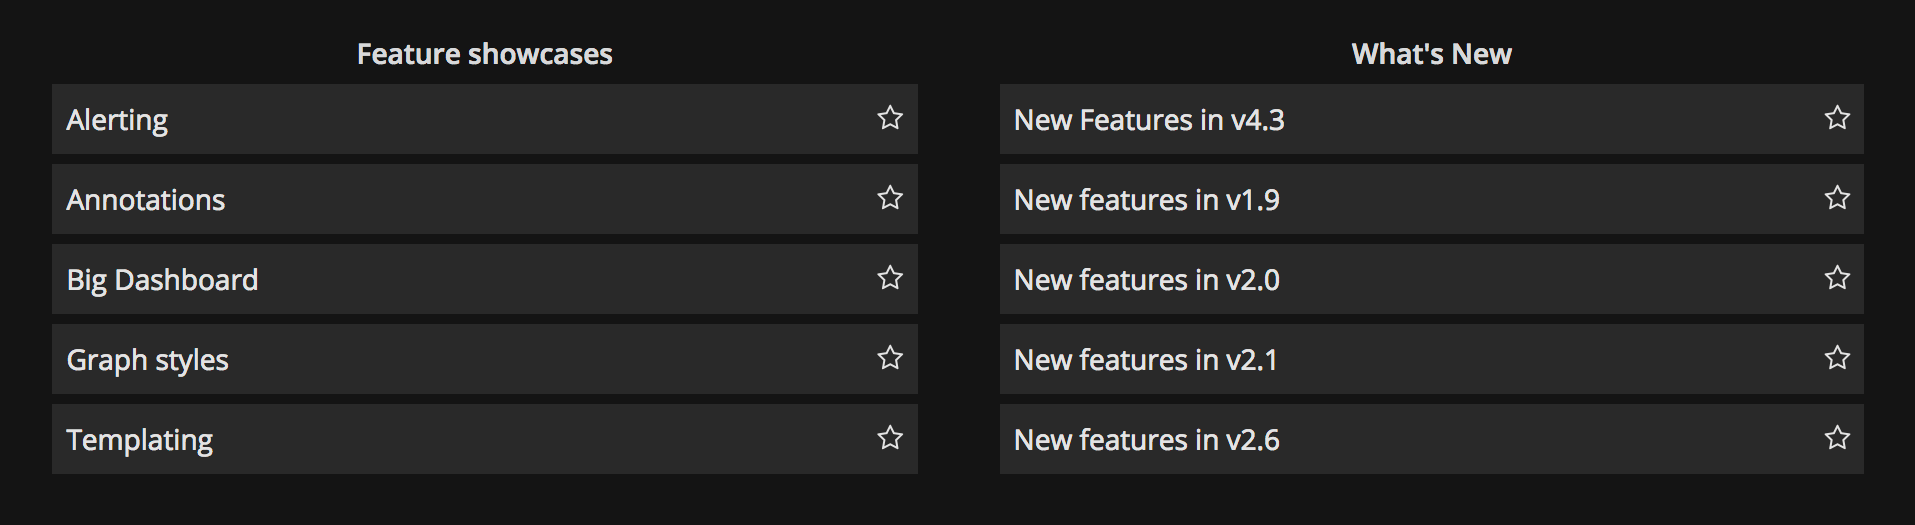
The dashboard list panel allows you to display dynamic links to other dashboards. The list can be configured to use starred dashboards, recently viewed dashboards, a search query, and dashboard tags.
On each dashboard load, this panel queries the dashboard list, always providing the most up-to-date results.
Options
Use these options to refine your visualization.
Options
- Starred - Display starred dashboards in alphabetical order.
- Recently viewed - Display recently viewed dashboards in alphabetical order.
- Search - Display dashboards by search query or tags. Requires you to enter at least one value in Query or Tags.
- Show headings - The chosen list selection (Starred, Recently viewed, Search) is shown as a heading.
- Max items - Sets the maximum number of items to list per section. For example, if you left this at the default value of 10 and displayed Starred and Recently viewed dashboards, then the panel would display up to 20 total dashboards, ten in each section.
Search
These options only apply if the Search option is selected.
- Query - Enter the query you want to search by. Queries are case-insensitive, and partial values are accepted.
- Folder - Select the dashboard folders that you want to display.
- Tags - Here is where you enter your tags you want to search by. Note that existing tags will not appear as you type, and they are case sensitive.
Note: When multiple tags and strings appear, the dashboard list displays those matching all conditions.


