
Important: This documentation is about an older version. It's relevant only to the release noted, many of the features and functions have been updated or replaced. Please view the current version.
Add a panel
Panels allow you to show your data in visual form. This topic walks you through the most basic steps to build a panel.
1. Add a panel to a dashboard
Navigate to the dashboard you want to add a panel to.
Click the Add panel icon.
![]()
Click Add new panel.
Grafana creates an empty graph panel with your default data source selected.
2. Edit panel settings
While not required, we recommend that you add a helpful title and description to your panel. You can use variables you have defined in either field, but not global variables.
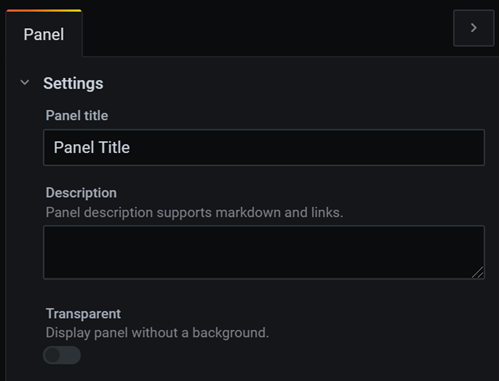
Panel title - Text entered in this field is displayed at the top of your panel in the panel editor and in the dashboard.
Description - Text entered in this field is displayed in a tooltip in the upper left corner of the panel. Write a description of the panel and the data you are displaying. Pretend you are explaining it to a new user six months from now, when it is no longer fresh in your mind. Future editors (possibly yourself) will thank you.
3. Write a query
Each panel needs at least one query to display a visualization. You write queries in the Query tab of the panel editor. For more information about the Query tab, refer to Queries.
- Choose a data source. In the first line of the Query tab, click the drop-down list to see all available data sources. This list includes all data sources you added. Refer to Add a data source if you need instructions.
- Write or construct a query in the query language of your data source. Options will vary. Refer to your specific data source documentation for specific guidelines.
4. Choose a visualization type
In the Visualization section of the Panel tab, click a visualization type. Grafana displays a preview of your query results with that visualization applied.
For more information about individual visualizations, refer to Visualizations.
5. Apply changes and save
Save the dashboard. Either press Ctrl/Cmd+S or click Save in the upper right corner of the screen.
Your options vary depending on the changes you made and whether or not it is a new dashboard. We recommend you add a note to describe your changes before you click Save. Notes are very helpful if you need to revert the dashboard to a previous version.
What next?
Our Grafana Fundamentals tutorial is a great place to start, or you can learn more about Grafana by reading one of the documentation topics linked below:
Learn more about panel editor options.
Add more queries.
Transform your data.
Configure how your results are displayed in the visualization.
If you made a graph panel, set up an alert.
Create templates and variables.


