Important: This documentation is about an older version. It's relevant only to the release noted, many of the features and functions have been updated or replaced. Please view the current version.
What’s new in Grafana v4.3
Grafana v4.3 Beta is now available for download.
Release Highlights
- New Heatmap Panel
- Graph Panel Histogram Mode
- Elasticsearch Histogram Aggregation
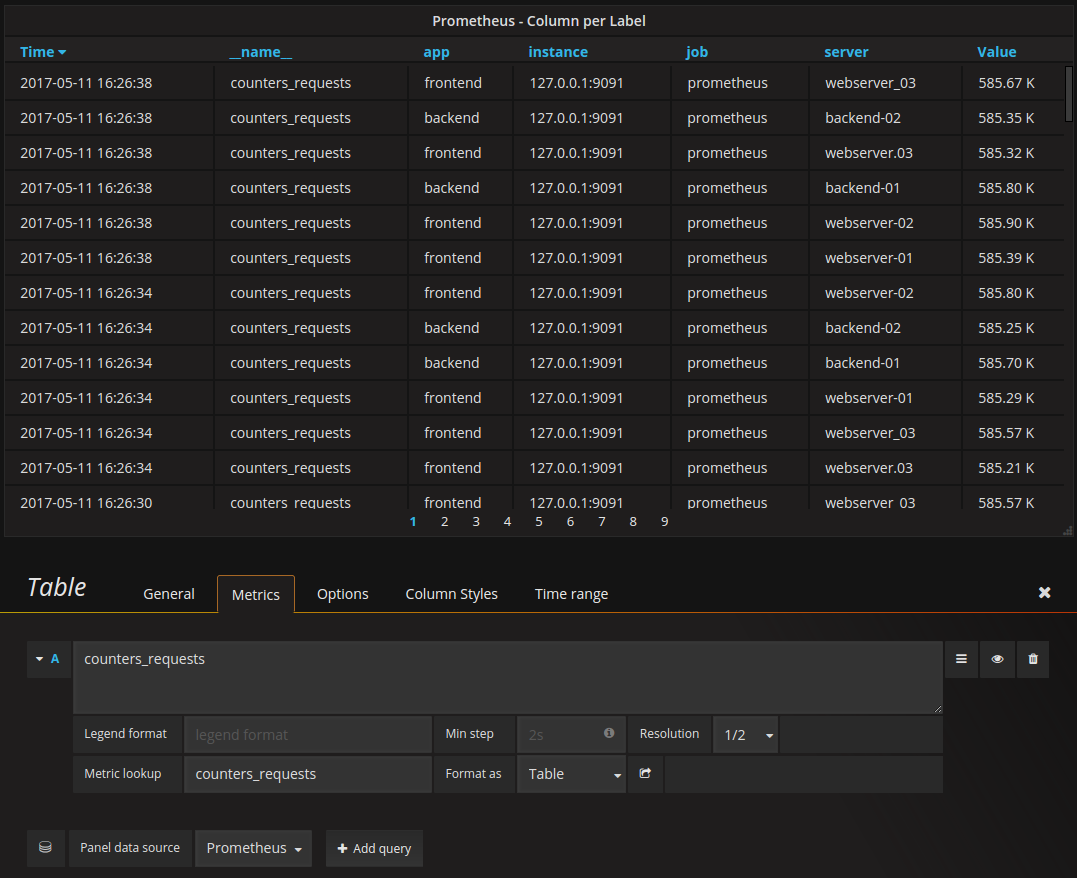
- Prometheus Table data format
- New MySQL Data Source (alpha version to get some early feedback)
- 60+ small fixes and improvements, most of them contributed by our fantastic community!
Check out the New Features in v4.3 Dashboard on the Grafana Play site for a showcase of these new features.
Histogram Support
A Histogram is a kind of bar chart that groups numbers into ranges, often called buckets or bins. Taller bars show that more data falls in that range.
The Graph Panel now supports Histograms.
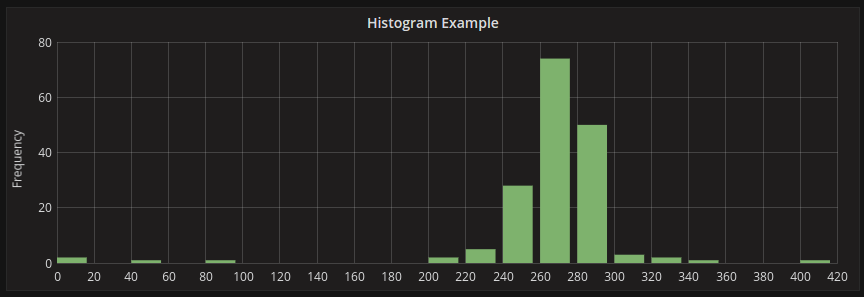
Histogram Aggregation Support for Elasticsearch
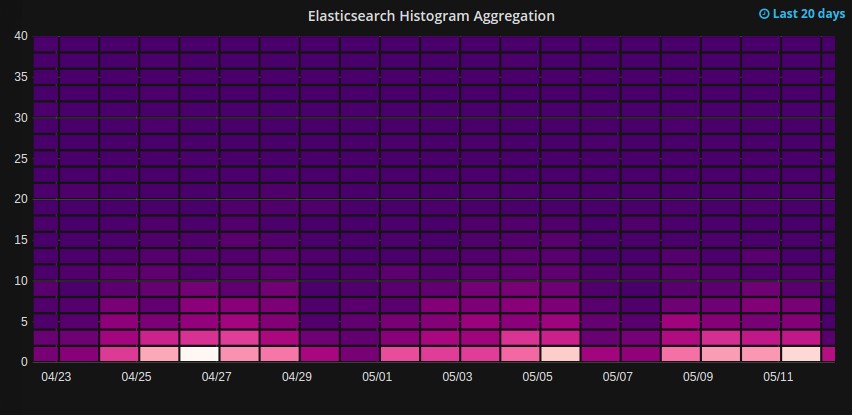
Elasticsearch is the only supported data source that can return pre-bucketed data (data that is already grouped into ranges). With other data sources there is a risk of returning inaccurate data in a histogram due to using already aggregated data rather than raw data. This release adds support for Elasticsearch pre-bucketed data that can be visualized with the new Heatmap Panel.
Heatmap Panel
The Histogram support in the Graph Panel does not show changes over time - it aggregates all the data together for the chosen time range. To visualize a histogram over time, we have built a new Heatmap Panel.
Every column in a Heatmap is a histogram snapshot. Instead of visualizing higher values with higher bars, a heatmap visualizes higher values with color. The histogram shown above is equivalent to one column in the heatmap shown below.
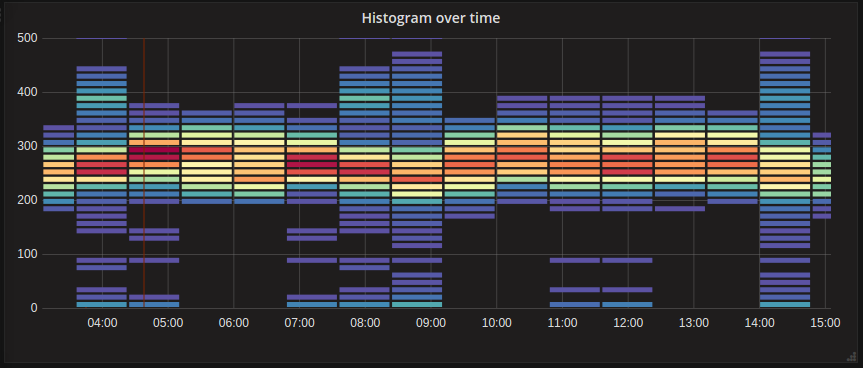
The Heatmap panel also works with Elasticsearch Histogram Aggregations for more accurate server side bucketing.
MySQL Data Source (alpha)
This release includes a new core data source for MySQL. You can write any possible MySQL query and format it as either Time Series or Table Data allowing it be used with the Graph Panel, Table Panel and SingleStat Panel.
We are still working on the MySQL data source. As it’s missing some important features, like templating and macros and future changes could be breaking, we are labeling the state of the data source as Alpha. Instead of holding up the release of v4.3 we are including it in its current shape to get some early feedback. So please try it out and let us know what you think on twitter or on our community forum. Is this a feature that you would use? How can we make it better?
The query editor can show the generated and interpolated SQL that is sent to the MySQL server.
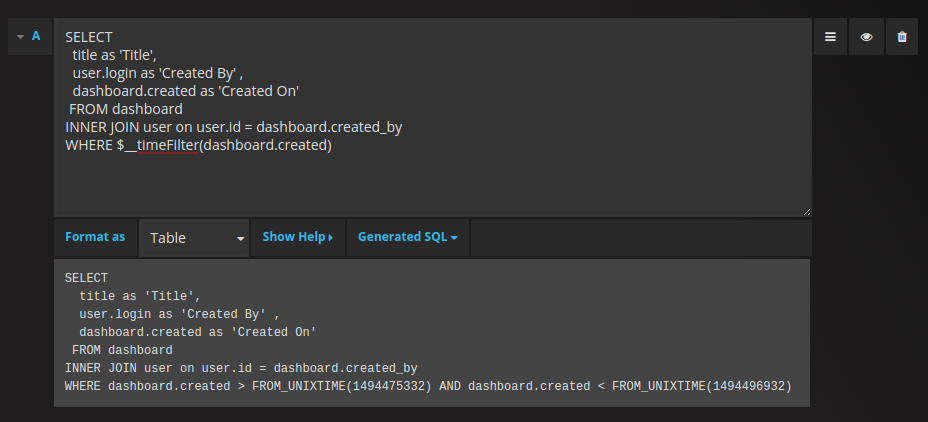
The query editor will also show any errors that resulted from running the query (very useful when you have a syntax error!).

Health Check Endpoint
Now you can monitor the monitoring with the Health Check Endpoint! The new /api/health endpoint returns HTTP 200 OK if everything is up and HTTP 503 Error if the Grafana database cannot be pinged.
Lazy Load Panels
Grafana now delays loading panels until they become visible (scrolled into view). This means panels out of view are not sending requests thereby reducing the load on your time series database.
Prometheus - Table Data (column per label)
The Prometheus data source now supports the Table Data format by automatically assigning a column to a label. This makes it really easy to browse data in the table panel.
Other Highlights From The Changelog
Changes:
- Table: Support to change column header text #3551
- InfluxDB: influxdb query builder support for ORDER BY and LIMIT (allows TOPN queries) #6065 Support influxdb’s SLIMIT Feature #7232 thx @thuck
- Graph: Support auto grid min/max when using log scale #3090, thx @bigbenhur
- Prometheus: Make Prometheus query field a textarea #7663, thx @hagen1778
- Server: Support listening on a Unix socket #4030, thx @mitjaziv
Fixes:
- MySQL: 4-byte UTF8 not supported when using MySQL database (allows Emojis in Dashboard Names) #7958
- Dashboard: Description tooltip is not fully displayed #7970
Lots more enhancements and fixes can be found in the Changelog.
Download
Head to the v4.3 download page for download links and instructions.
Thanks
A big thanks to all the Grafana users who contribute by submitting PRs, bug reports, helping out on our community site and providing feedback!


