Important: This documentation is about an older version. It's relevant only to the release noted, many of the features and functions have been updated or replaced. Please view the current version.
What’s new in Grafana v6.7
This topic includes the release notes for the Grafana v6.7, which is currently in beta. For all details, read the full CHANGELOG.md.
Grafana 6.7 comes with a lot of new features and enhancements:
- Dashboard: Enforce minimum refresh interval
- Data source: Google Sheets data source
- Explore: Query history
- Authorization: Azure OAuth
- Stackdriver: Project Selector
- Enterprise: White Labeling for application title
- Enterprise: Reporting configuration for timeout and concurrency
- Enterprise: Export dashboard as pdf
- Enterprise: Report landscape mode
- Enterprise: Azure OAuth Team Sync support
General features
Query history
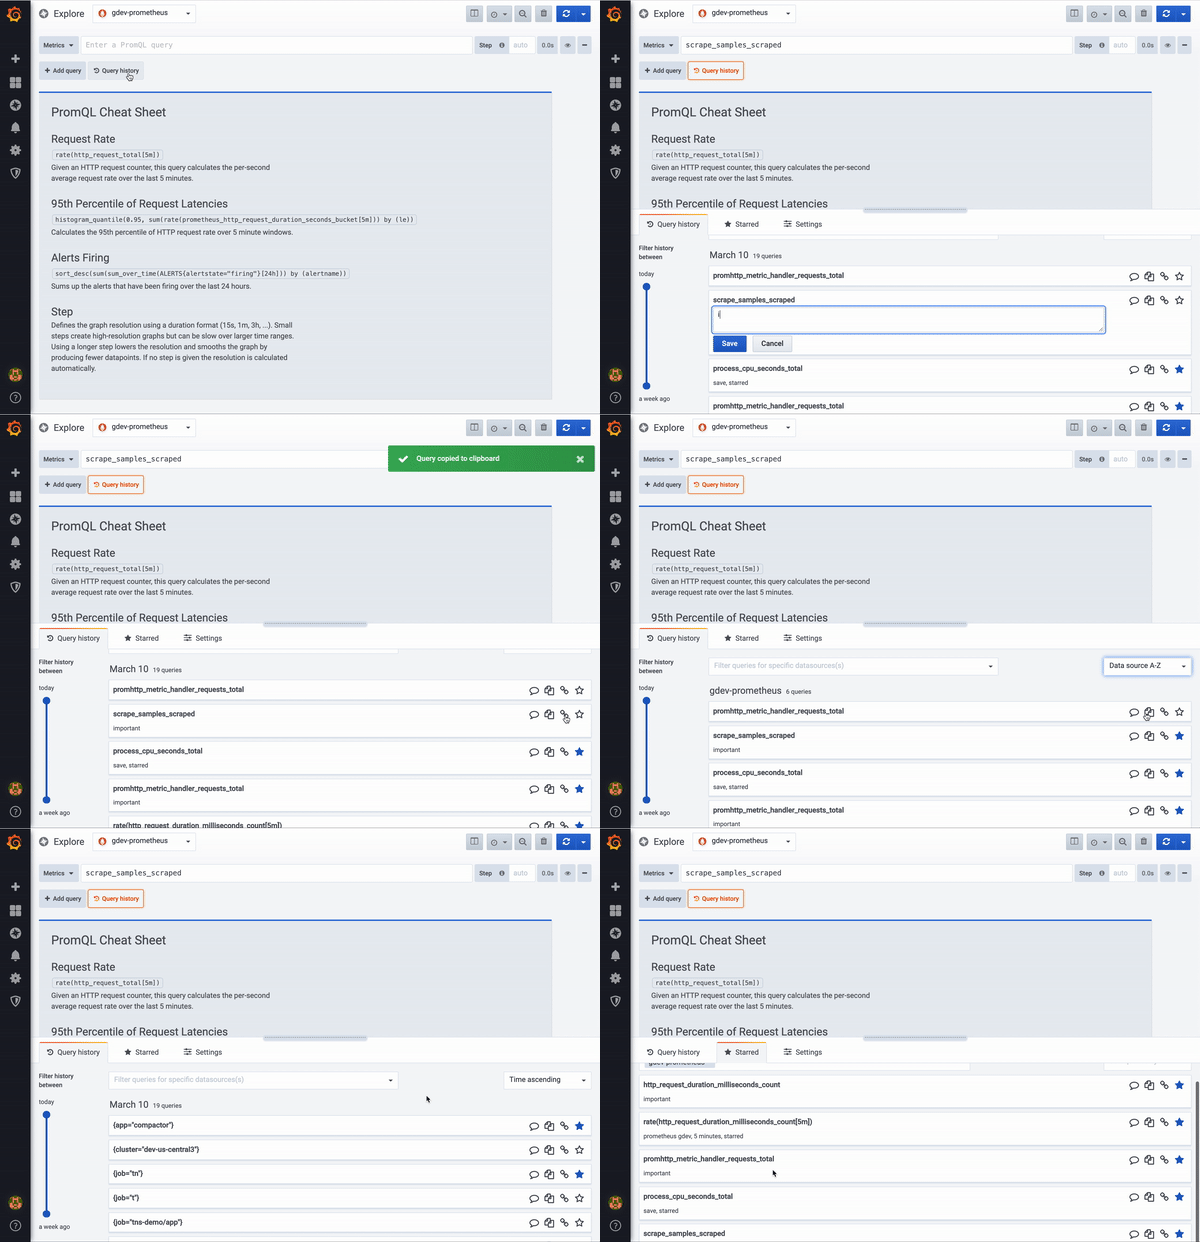
BETA: Query history is a beta feature. It is local to your browser and is not shared with others.
Query history is a new feature that lets you view and interact with the queries that you have previously run in Explore. You can add queries to the Explore query editor, write comments, create and share URL link, star your favourite queries and much more. Starred queries are displayed in “Starred” tab as well, so it is easier to reuse queries that you run often without typing them from scratch.
Learn more about query history in documentation.

Azure OAuth
Grafana 6.7 comes with a new OAuth integration for Microsoft Azure Active Directory. It’s possible to assign Users and Groups to Grafana roles from the Azure Portal. Learn how to enable and configure it in the documentation.
Enforce minimum dashboard refresh interval
Allowing a low dashboard refresh interval can cause severe load on data sources and Grafana. Grafana v6.7 allows you to restrict the dashboard refresh interval so it cannot be set lower than a given interval. This provides a way for administrators to control dashboard refresh behavior on a global level.
Refer to min_refresh_interval in Configuration for further information and how to enable this.
Stackdriver Project Selector
A Stackdriver data source in Grafana is configured for one service account only. That service account is always associated with a default project in Google Cloud Platform (GCP). Depending on your setup in GCP, the service account might be granted access to more projects than just the default project.
In Grafana 6.7, the query editor has been enhanced with a project selector that makes it possible to query different projects without changing datasource. Many thanks Eraac, eliaslaouiti and NaurisSadovskis for making this happen!
Grafana enterprise features
White Labeling for application title
This release adds a new white labeling option to customize the application title. Learn how to configure it in the documentation.
[white_labeling]
# Set to your company name to override application title
app_title = Your Company
Reporting configuration for timeout and concurrency
This release adds more configuration for the reporting feature rendering requests. You can set the panel rendering request timeout and the maximum number of concurrent calls to the rendering service in your configuration. Learn how to do it in the documentation.
[reporting]
# Set timeout for each panel rendering request
rendering_timeout = 10s
# Set maximum number of concurrent calls to the rendering service
concurrent_render_limit = 10
Export dashboard as pdf
This feature allows you to export the dashboard as a PDF document. All dashboard panels will be rendered as images and added into the PDF document.
Report landscape mode
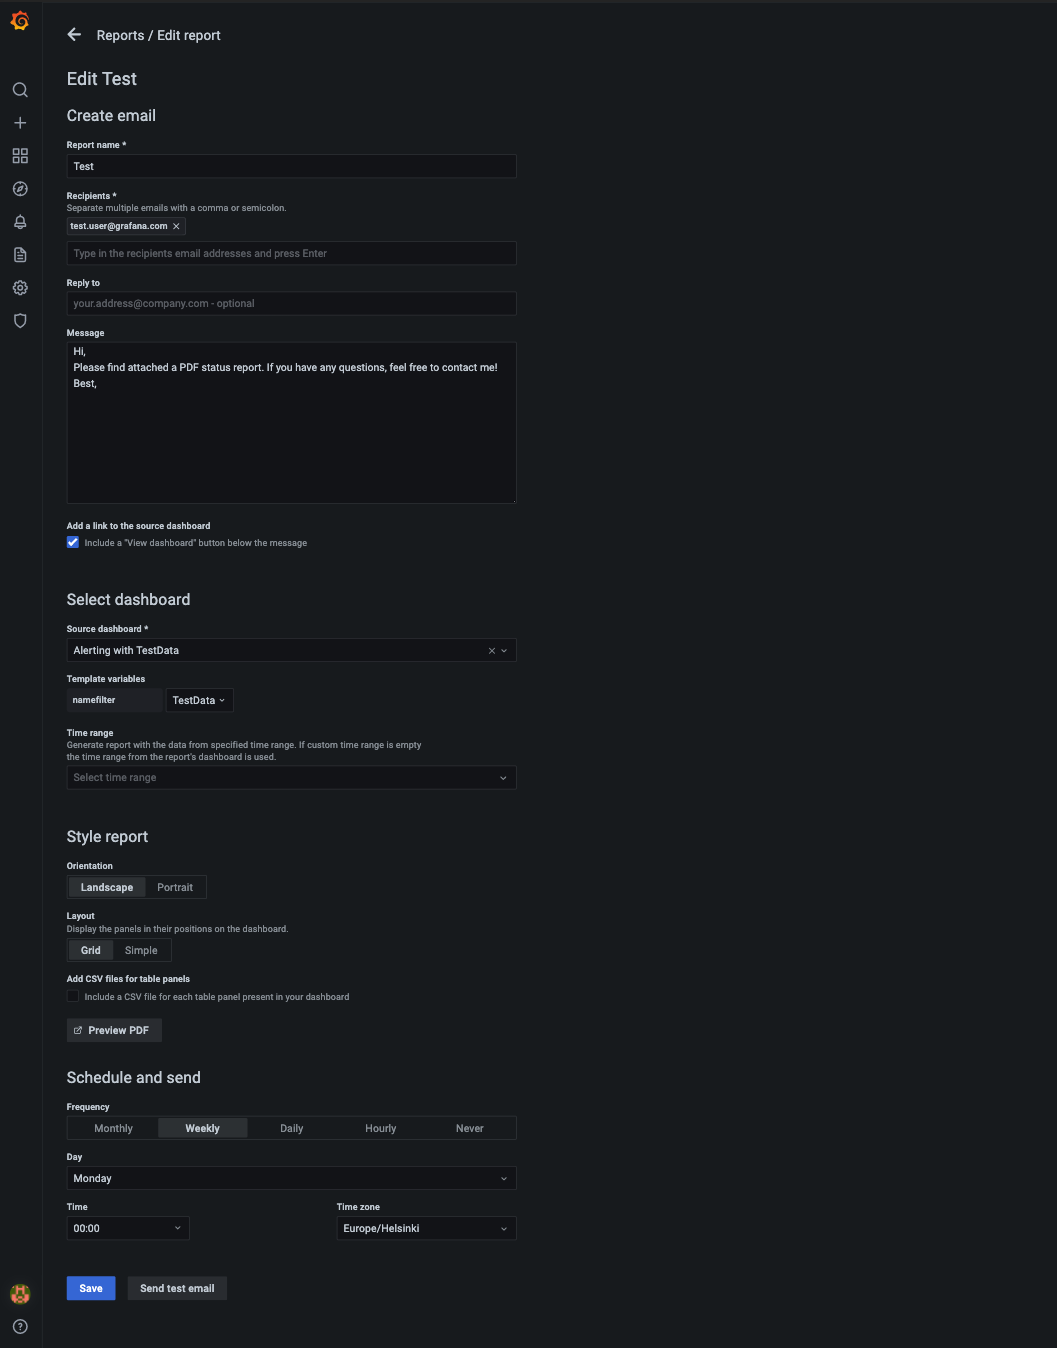
You can now use either portrait or landscape mode in your reports. Portrait will render three panels per page and landscape two.
Azure OAuth Team Sync support
When setting up OAuth with Microsoft Azure AD it’s now possible to sync Azure groups with Teams in Grafana. Learn more.


