Important: This documentation is about an older version. It's relevant only to the release noted, many of the features and functions have been updated or replaced. Please view the current version.
What’s New in Grafana v5.1
Grafana v5.1 brings new features, many enhancements and bug fixes. This article will detail the major new features and enhancements.
- Improved scrolling experience
- Improved docker image with a breaking change!
- Heatmap support for Prometheus
- Microsoft SQL Server as metric and table data source!
- Dashboards and Panels Improved adding panels to dashboards and enhancements to Graph and Table panels.
- New variable interpolation syntax
- Improved workflow for provisioned dashboards
Improved scrolling experience
In Grafana v5.0 we introduced a new scrollbar component. Unfortunately this introduced a lot of issues and in some scenarios removed the native scrolling functionality. Grafana v5.1 ships with a native scrollbar for all pages together with a scrollbar component for the dashboard grid and panels that’s not overriding the native scrolling functionality. We hope that these changes and improvements should make the Grafana user experience much better!
Improved docker image (breaking change)
Grafana v5.1 brings an improved official docker image which should make it easier to run and use the Grafana docker image and at the same time give more control to the user how to use/run it.
We’ve switched the id of the grafana user running Grafana inside a docker container. Unfortunately this means that files created prior to 5.1 won’t have the correct permissions for later versions and thereby this introduces a breaking change. We made this change so that it would be easier for you to control what user Grafana is executed as (see examples below).
= 5.1 | grafana | 472
Please read the updated documentation which includes migration instructions and more information.
Prometheus
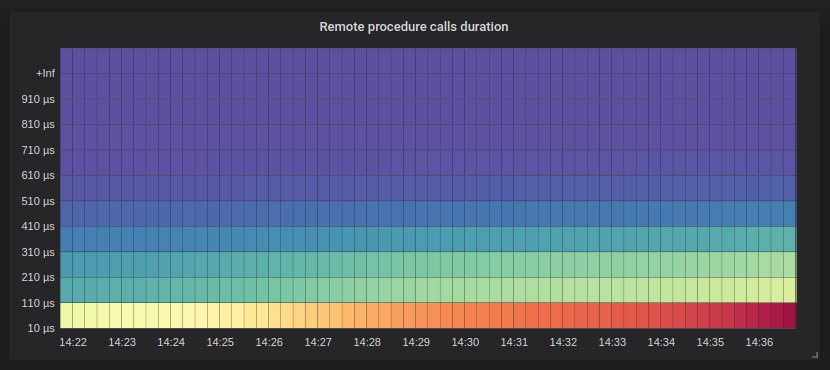
The Prometheus data source now support transforming Prometheus histograms to the heatmap panel. Prometheus histogram is a powerful feature, and we’re really happy to finally allow our users to render those as heatmaps. Please read Heatmap panel documentation for more information on how to use it.
Prometheus query editor also got support for autocomplete of template variables. More information in the Prometheus data source documentation.
Microsoft SQL Server
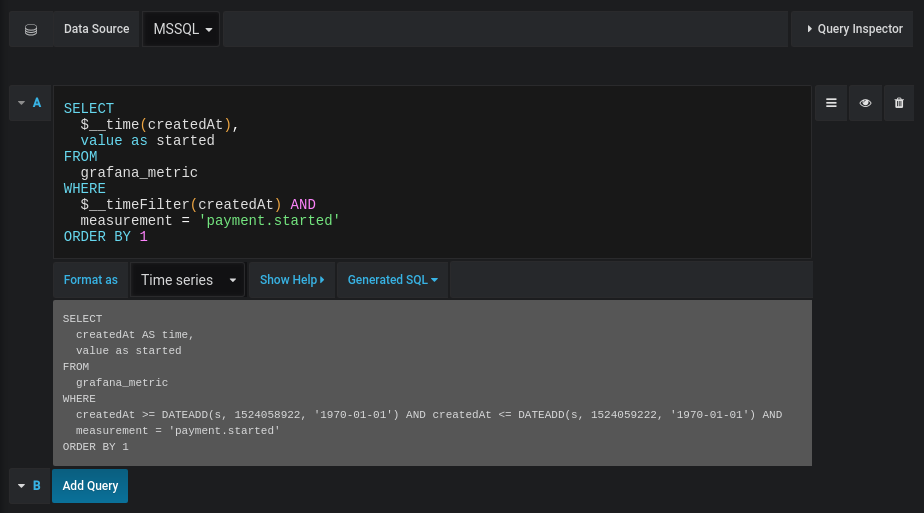
Grafana v5.1 now ships with a built-in Microsoft SQL Server (MSSQL) data source plugin that allows you to query and visualize data from any Microsoft SQL Server 2005 or newer, including Microsoft Azure SQL Database. Do you have metric or log data in MSSQL? You can now visualize that data and define alert rules on it like with any of Grafana’s other core data sources.
Please read Using Microsoft SQL Server in Grafana documentation for more detailed information on how to get started and use it.
Dashboards and Panels
Adding new panels to dashboards
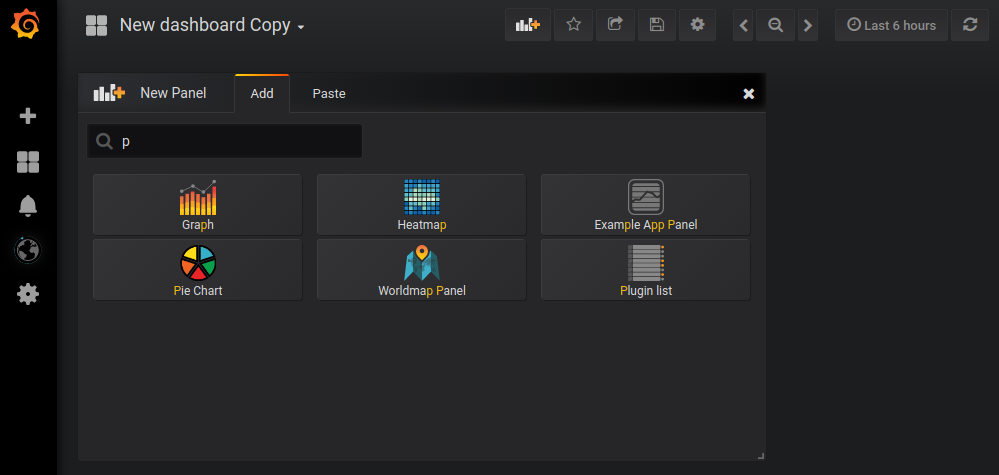
The control for adding new panels to dashboards have got some enhancements and now includes functionality to search for the type of panel you want to add. Further, the control has tabs separating functionality for adding new panels and pasting copied panels.
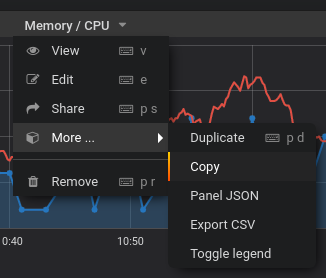
By copying a panel in a dashboard it will be displayed in the Paste tab in any dashboard and allows you to paste the
copied panel into the current dashboard.
Graph Panel
New enhancements includes support for multiple series stacking in histogram mode, thresholds for right Y axis, aligning left and right Y-axes to one level and additional units. More information in the Graph panel documentation.
Table Panel
New enhancements includes support for mapping a numeric value/range to text and additional units. More information in the Table panel documentation.
New variable interpolation syntax
We now support a new option for rendering variables that gives the user full control of how the value(s) should be rendered. In the table below you can see some examples and you can find all different options in the Variables documentation.
Improved workflow for provisioned dashboards
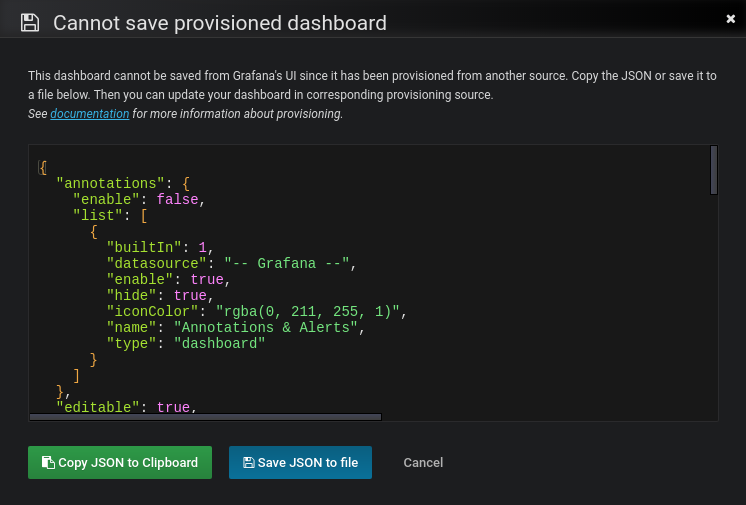
Grafana v5.1 brings an improved workflow for provisioned dashboards:
- A populated
idproperty in JSON is now automatically removed when provisioning dashboards. - When making changes to a provisioned dashboard you can
Savethe dashboard which now will bring up a Cannot save provisioned dashboard dialog like seen in the screenshot to the right.
Available options in the dialog will let you Copy JSON to Clipboard and/or Save JSON to file which can help you synchronize your dashboard changes back to the provisioning source.
More information in the Provisioning documentation.
Changelog
Check out the CHANGELOG.md file for a complete list of new features, changes, and bug fixes.


