Important: This documentation is about an older version. It's relevant only to the release noted, many of the features and functions have been updated or replaced. Please view the current version.
What’s new in Grafana v2.1
Grafana 2.1 brings improvements in three core areas: dashboarding, authentication, and data sources. As with every Grafana release, there is a whole slew of new features, enhancements, and bug fixes.
More Dynamic Dashboards
The Templating system is one of the most powerful and well-used features of Grafana. The 2.1 release brings numerous improvements that make dashboards more dynamic than ever before.
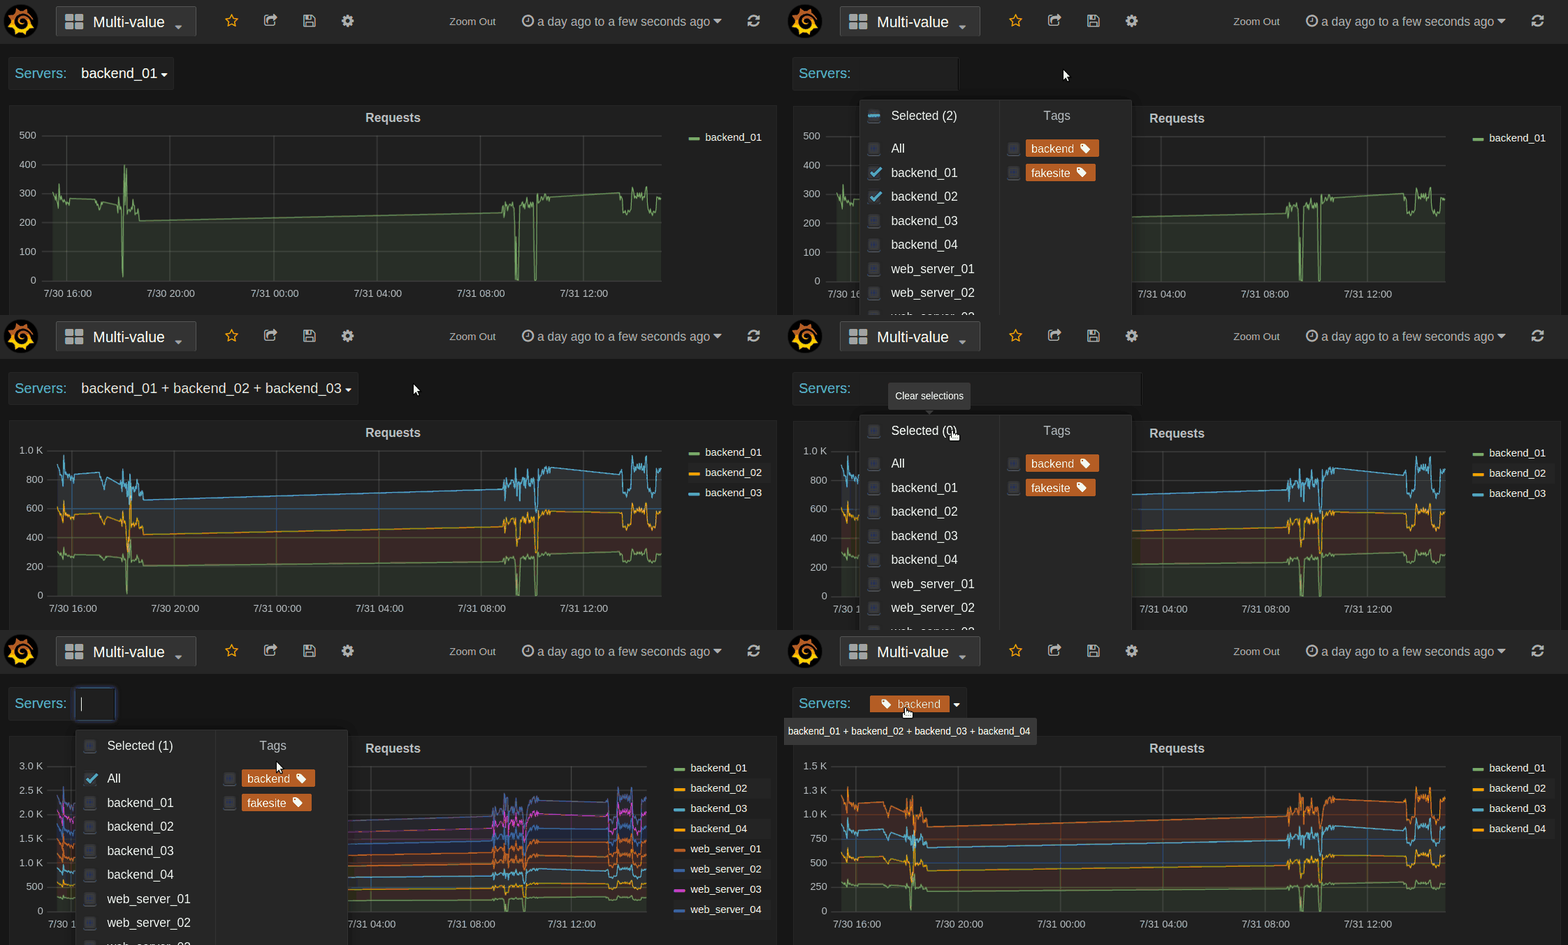
Multi-Value Template Variables
A template variable with Multi-Value enabled allows for the selection of multiple values at the same time.
These variables can then be used in any Panel to make them more dynamic, and to give you the perfect view of your data.
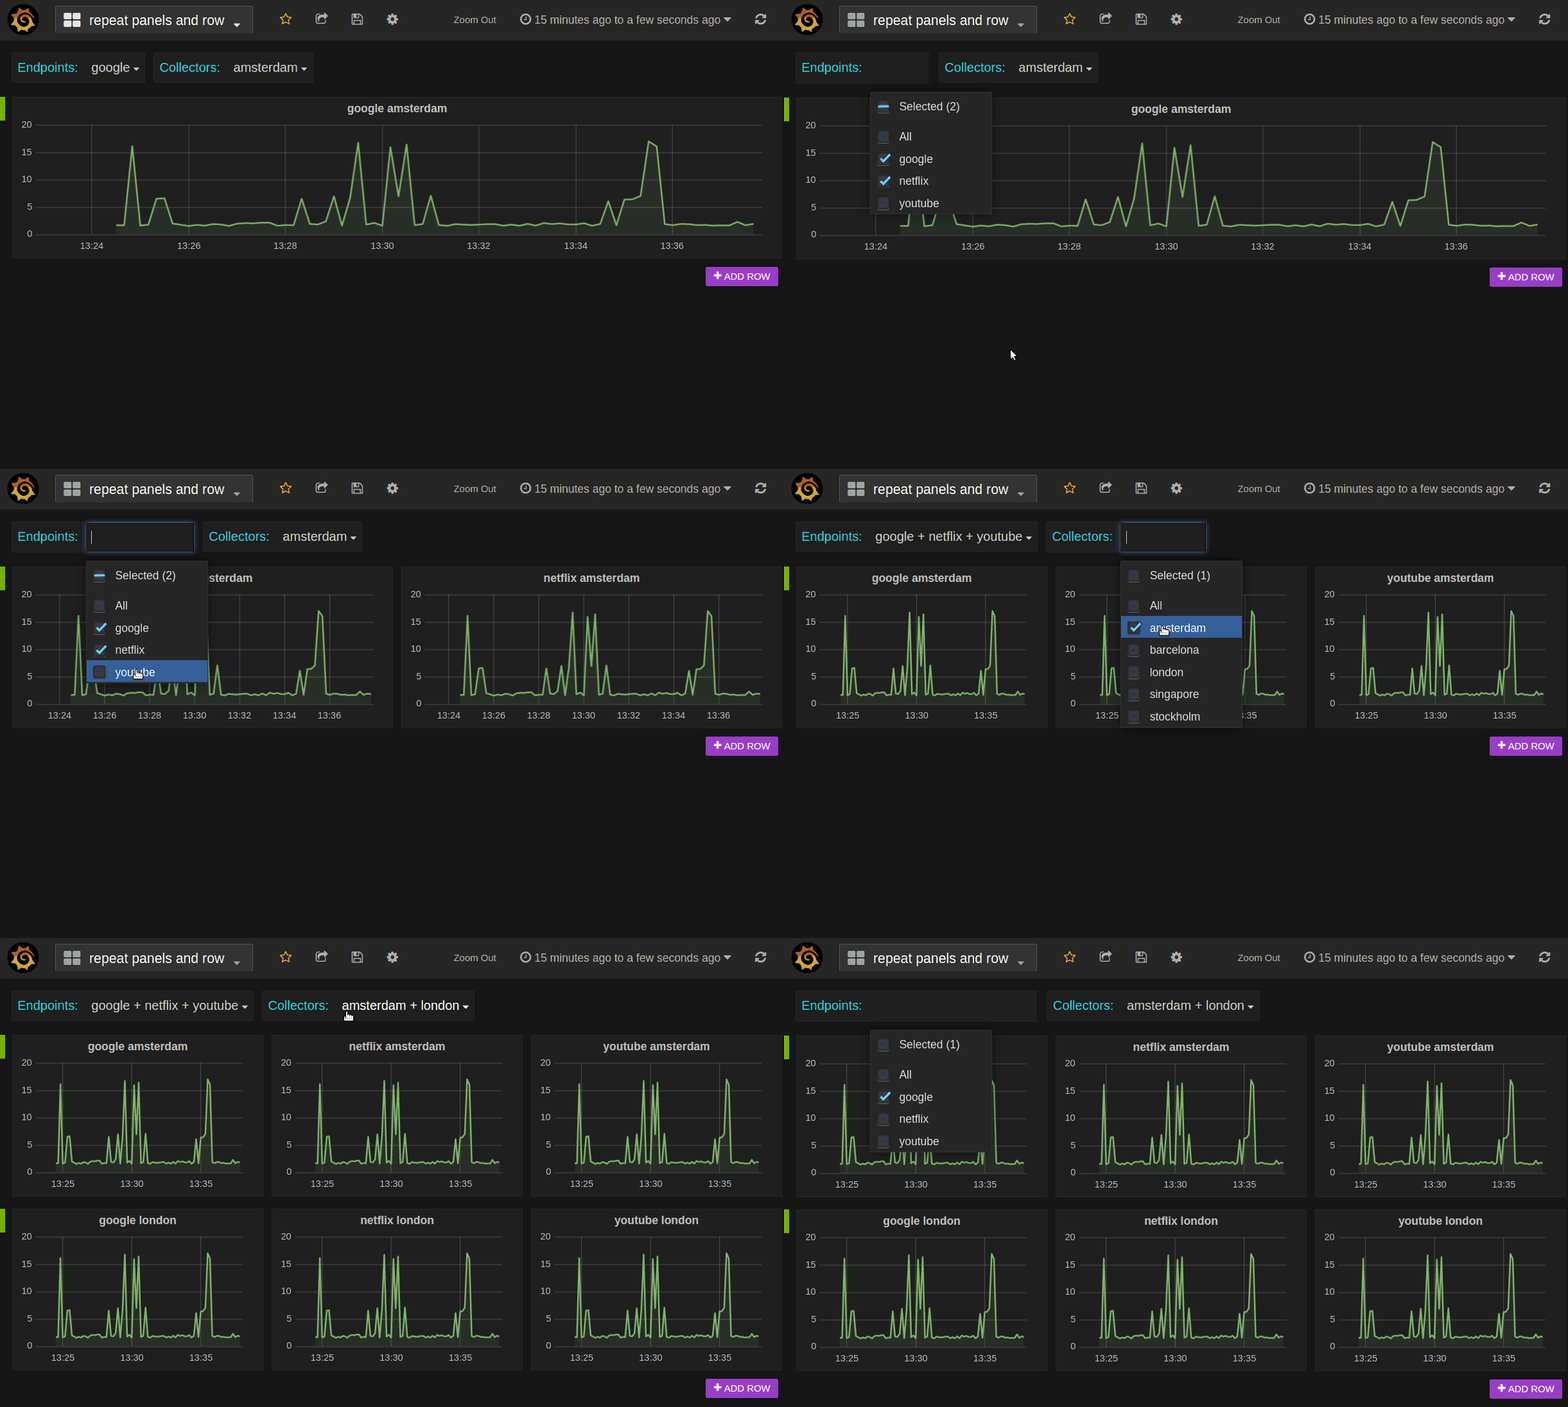
Multi-Value variables is also enabling the new row repeat and panel repeat feature described below.

Repeating Rows and Panels
It’s now possible to create a dashboard that automatically adds (or removes) both rows and panels based on selected variable values. Any row or any panel can be configured to repeat (duplicate itself) based on a multi-value template variable.

Dashboard Links and Navigation
To support better navigation between dashboards, it’s now possible to create custom and dynamic links from individual panels to appropriate Dashboards. You also have the ability to create flexible top-level links on any given dashboard thanks to the new dashboard navigation bar feature.

Dashboard links can be added under dashboard settings. Either defined as static URLs with a custom icon or as dynamic dashboard links or dropdowns based on custom dashboard search query. These links appear in the same row under the top menu where template variables appear.
Better local Dashboard support
Grafana can now index Dashboards saved locally as JSON from a given directory. These file based dashboards will appear in the regular dashboard search along regular DB dashboards.
Note: Saving local dashboards back the folder is not supported; this feature is meant for statically generated JSON dashboards.
New Authentication Options
New authentication methods add numerous options to manage users, roles and organizations.
LDAP support
This highly requested feature now allows your Grafana users to login with their LDAP credentials. You can also specify mappings between LDAP group memberships and Grafana Organization user roles.
Basic Auth Support
You can now authenticate against the Grafana API utilizing a simple username and password with basic HTTP authentication.
Note: This can be useful for provisioning and config management systems that need to utilize the API without having to create an API key.
Auth Proxy Support
You can now authenticate utilizing a header (eg. X-Authenticated-User, or X-WEBAUTH-USER)
Note: this can be useful in situations with reverse proxies.
New “Read-only Editor” User Role
There is a new User role available in this version of Grafana: “Read-only Editor”. This role behaves just like the Viewer role does in Grafana 2.0. That is you can edit graphs and queries but not save dashboards. The Viewer role has been modified in Grafana 2.1 so that users assigned this role can no longer edit panels.
Data source Improvements
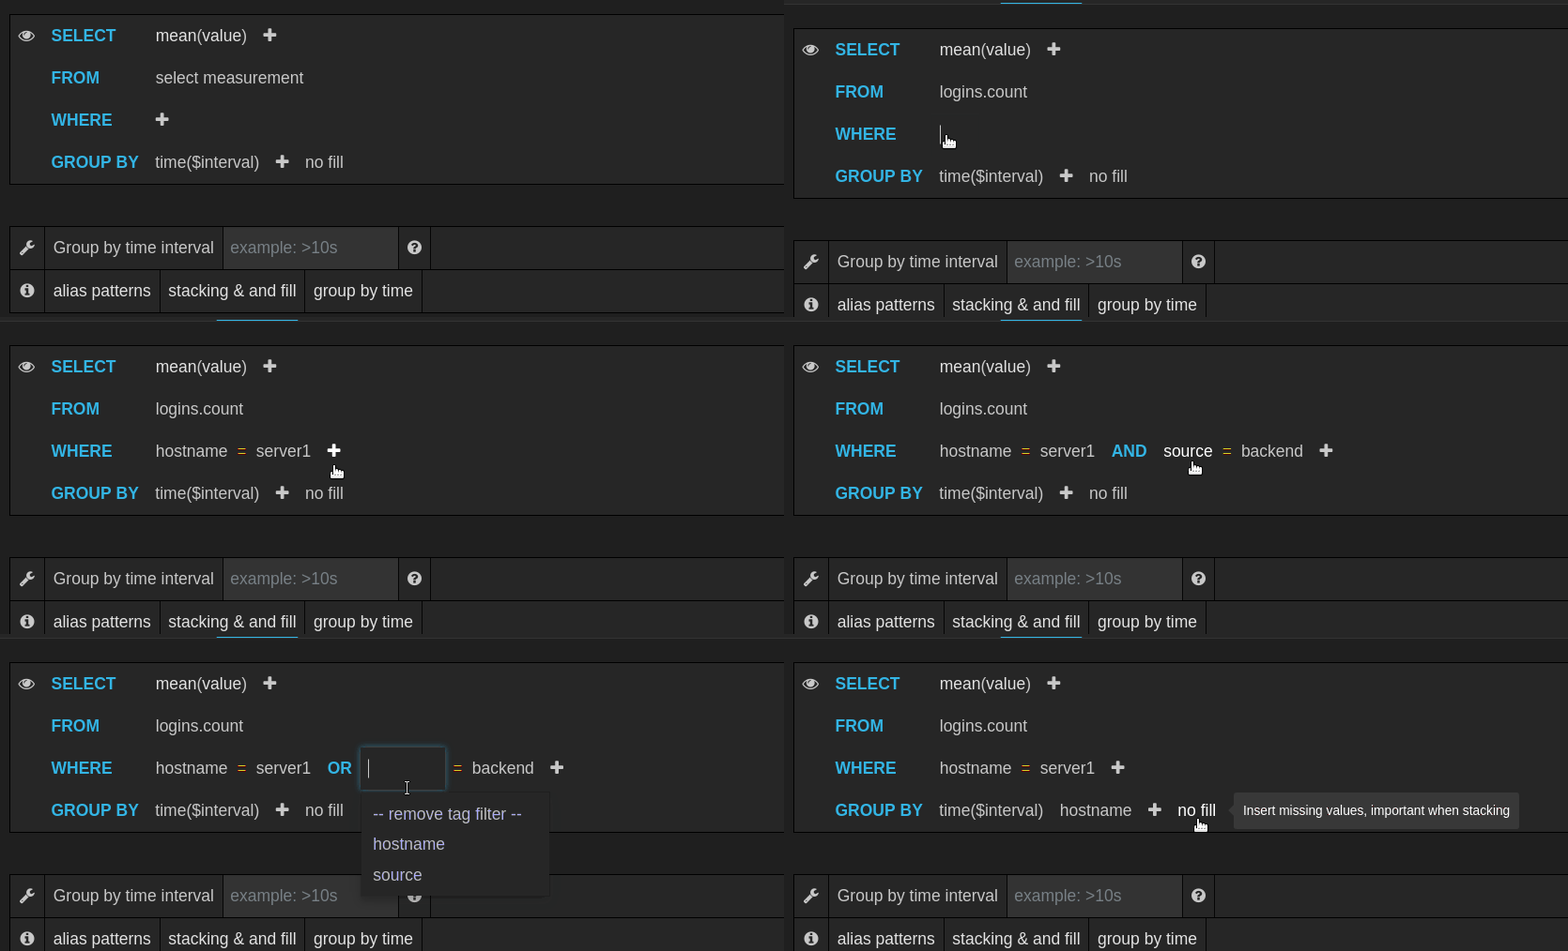
InfluxDB 0.9 Support
Grafana 2.1 now comes with full support for InfluxDB 0.9. There is a new query editor designed from scratch for the new features InfluxDB 0.9 enables.

OpenTSDB Improvements
Grafana OpenTSDB data source now supports template variable values queries. This means you can create template variables that fetches the values from OpenTSDB (for example metric names, tag names, or tag values). The query editor is also enhanced to limiting tags by metric.
Note: OpenTSDB config option tsd.core.meta.enable_realtime_ts must enabled for OpenTSDB lookup api)
New Data Source: KairosDB
The Cassandra backed time series database KairosDB is now supported in Grafana out of the box. Thank you to masaori335 for his hard work in getting it to this point.
Panel Improvements
Grafana 2.1 gives you even more flexibility customizing how individual panels render. Overriding the colors of specific series using regular expressions, changing how series stack, and allowing string values will help you better understand your data at a glance.
Graph Panel
Define series color using regex rule. This is useful when you have templated graphs with series names
that change depending selected template variables. Using a regex style override rule you could
for example make all series that contain the word CPU red and assigned to the second y axis.

New series style override, negative-y transform and stack groups. Negative y transform is very useful if you want to plot a series on the negative y scale without affecting the legend values like min or max or the values shown in the hover tooltip.


Singlestat Panel
Now support string values. Useful for time series database like InfluxDB that supports string values.
Changelog
For a detailed list and link to github issues for everything included in the 2.1 release please view the CHANGELOG.md file.


