Important: This documentation is about an older version. It's relevant only to the release noted, many of the features and functions have been updated or replaced. Please view the current version.
Explore
Explore is only available in Grafana 6.0 and above.
Introduction
One of the major new features of Grafana 6.0 is the new query-focused Explore workflow for troubleshooting and/or for data exploration.
Grafana’s dashboard UI is all about building dashboards for visualization. Explore strips away all the dashboard and panel options so that you can focus on the query. Iterate until you have a working query and then think about building a dashboard.
For infrastructure monitoring and incident response, you no longer need to switch to other tools to debug what went wrong. Explore allows you to dig deeper into your metrics and logs to find the cause. Grafana’s new logging data source, Loki is tightly integrated into Explore and allows you to correlate metrics and logs by viewing them side-by-side. This creates a new debugging workflow where you can:
- Receive an alert
- Drill down and examine metrics
- Drill down again and search logs related to the metric and time interval (and in the future, distributed traces).
If you just want to explore your data and do not want to create a dashboard then Explore makes this much easier. Explore will show the results as both a graph and a table enabling you to see trends in the data and more detail at the same time (if the data source supports both graph and table data).
How to Start Exploring
There is a new Explore icon on the menu bar to the left. This opens a new empty Explore tab.

If you want to start with an existing query in a panel then choose the Explore option from the Panel menu. This opens an Explore tab with the query from the panel and allows you to tweak or iterate in the query outside of your dashboard.

Choose your data source in the dropdown in the top left. Prometheus has a custom Explore implementation, the other data sources (for now) use their standard query editor.
The query field is where you can write your query and explore your data. There are three buttons beside the query field, a clear button (X), an add query button (+) and the remove query button (-). Just like the normal query editor, you can add and remove multiple queries.
Split and Compare
The Split feature is an easy way to compare graphs and tables side-by-side or to look at related data together on one page. Click the split button to duplicate the current query and split the page into two side-by-side queries. It is possible to select another data source for the new query which for example, allows you to compare the same query for two different servers or to compare the staging environment to the production environment.

In split view, timepickers for both panels can be linked (if you change one, the other gets changed as well) by clicking on one of the time-sync buttons attached to the timepickers. Linking of timepickers helps with keeping the start and the end times of the split view queries in sync and it will ensure that you’re looking at the same time interval in both split panels.
You can close the newly created query by clicking on the Close Split button.
Prometheus-specific Features
The first version of Explore features a custom querying experience for Prometheus. When a query is executed, it actually executes two queries, a normal Prometheus query for the graph and an Instant Query for the table. An Instant Query returns the last value for each time series which shows a good summary of the data shown in the graph.
Metrics Explorer
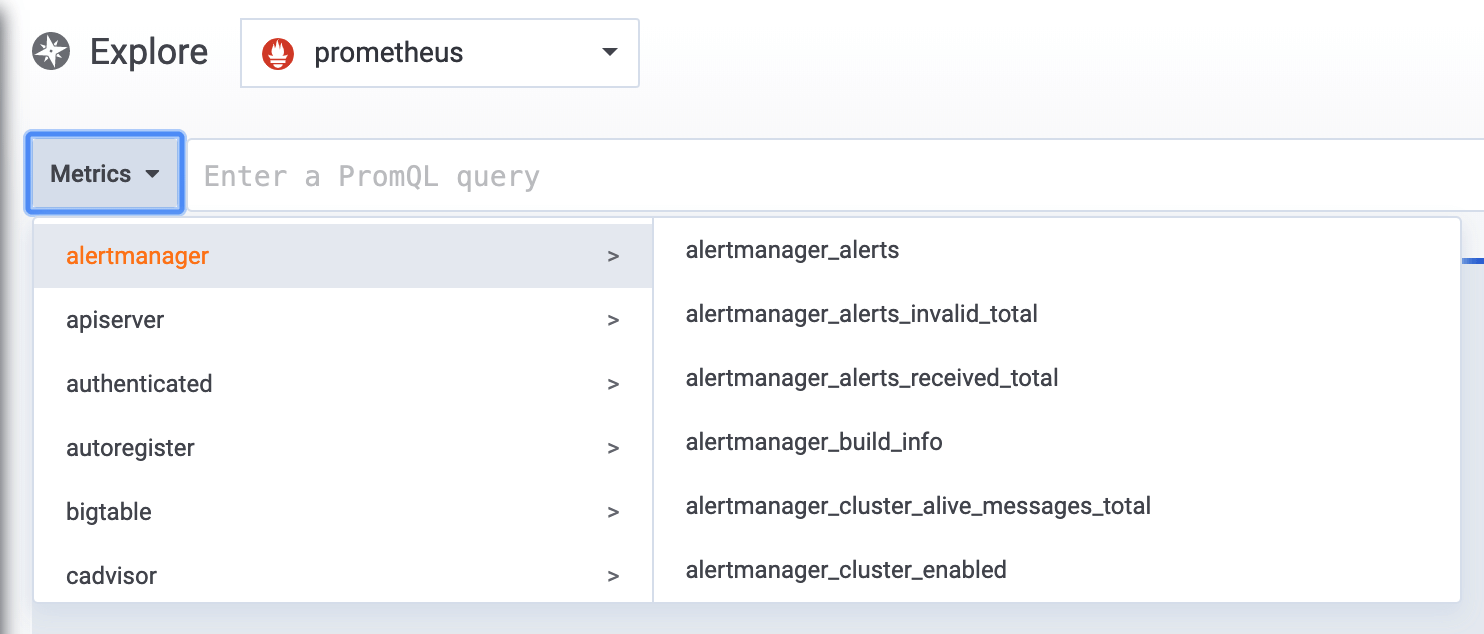
On the left-hand side of the query field is a Metrics button, clicking on this opens the Metric Explorer. This shows a hierarchical menu with metrics grouped by their prefix. For example, all the Alert Manager metrics will be grouped under the alertmanager prefix. This is a good starting point if you just want to explore which metrics are available.

Query Field
The Query field supports autocomplete for metric names, function and works mostly the same way as the standard Prometheus query editor. Press the enter key to execute a query.
The autocomplete menu can be trigger by pressing Ctrl+Space. The Autocomplete menu contains a new History section with a list of recently executed queries.
Suggestions can appear under the query field - click on them to update your query with the suggested change.
- For counters (monotonically increasing metrics), a rate function will be suggested.
- For buckets, a histogram function will be suggested.
- For recording rules, possible to expand the rules.
Table Filters
Click on the filter button in a labels column in the Table panel to add filters to the query expression. This works with multiple queries too - the filter will be added for all the queries.
Logs Integration
Along with metrics, Explore allows you to investigate your logs with the following data sources:
Deduping
Log data can be very repetitive and Explore can help by hiding duplicate log lines. There are a few different deduplication algorithms that you can use:
exactExact matches are done on the whole line, except for date fields.numbersMatches on the line after stripping out numbers (durations, IP addresses etc.).signatureThe most aggressive deduping - strips all letters and numbers, and matches on the remaining whitespace and punctuation.
Timestamp and Local time
There are some other check boxes under the logging graph apart from the Deduping options.
- Timestamp: shows/hides the Timestamp column
- Local time: shows/hides the Local time column
Labels and Parsed fields
Each log row has an extendable area with its labels and parsed fields, for more robust interaction. For all labels we have added the ability to filter for (positive filter) and filter out (negative filter) selected labels. Each field or label also has a stats icon to display ad-hoc statistics in relation to all displayed logs.
Loki-specific Features
As mentioned, one of the log integrations is for the new open source log aggregation system from Grafana Labs - Loki. Loki is designed to be very cost effective, as it does not index the contents of the logs, but rather a set of labels for each log stream. The logs from Loki are queried in a similar way to querying with label selectors in Prometheus. It uses labels to group log streams which can be made to match up with your Prometheus labels. Read more about Grafana Loki here or the Grafana Labs hosted variant: Grafana Cloud Logs.
See Loki’s data source documentation on how to query for log data.
Switching from Metrics to Logs
If you switch from a Prometheus query to a logs query (you can do a split first to have your metrics and logs side by side) then it will keep the labels from your query that exist in the logs and use those to query the log streams. For example, the following Prometheus query:
grafana_alerting_active_alerts{job="grafana"}
after switching to the Logs data source, the query changes to:
{job="grafana"}
This will return a chunk of logs in the selected time range that can be grepped/text searched.
Live tailing
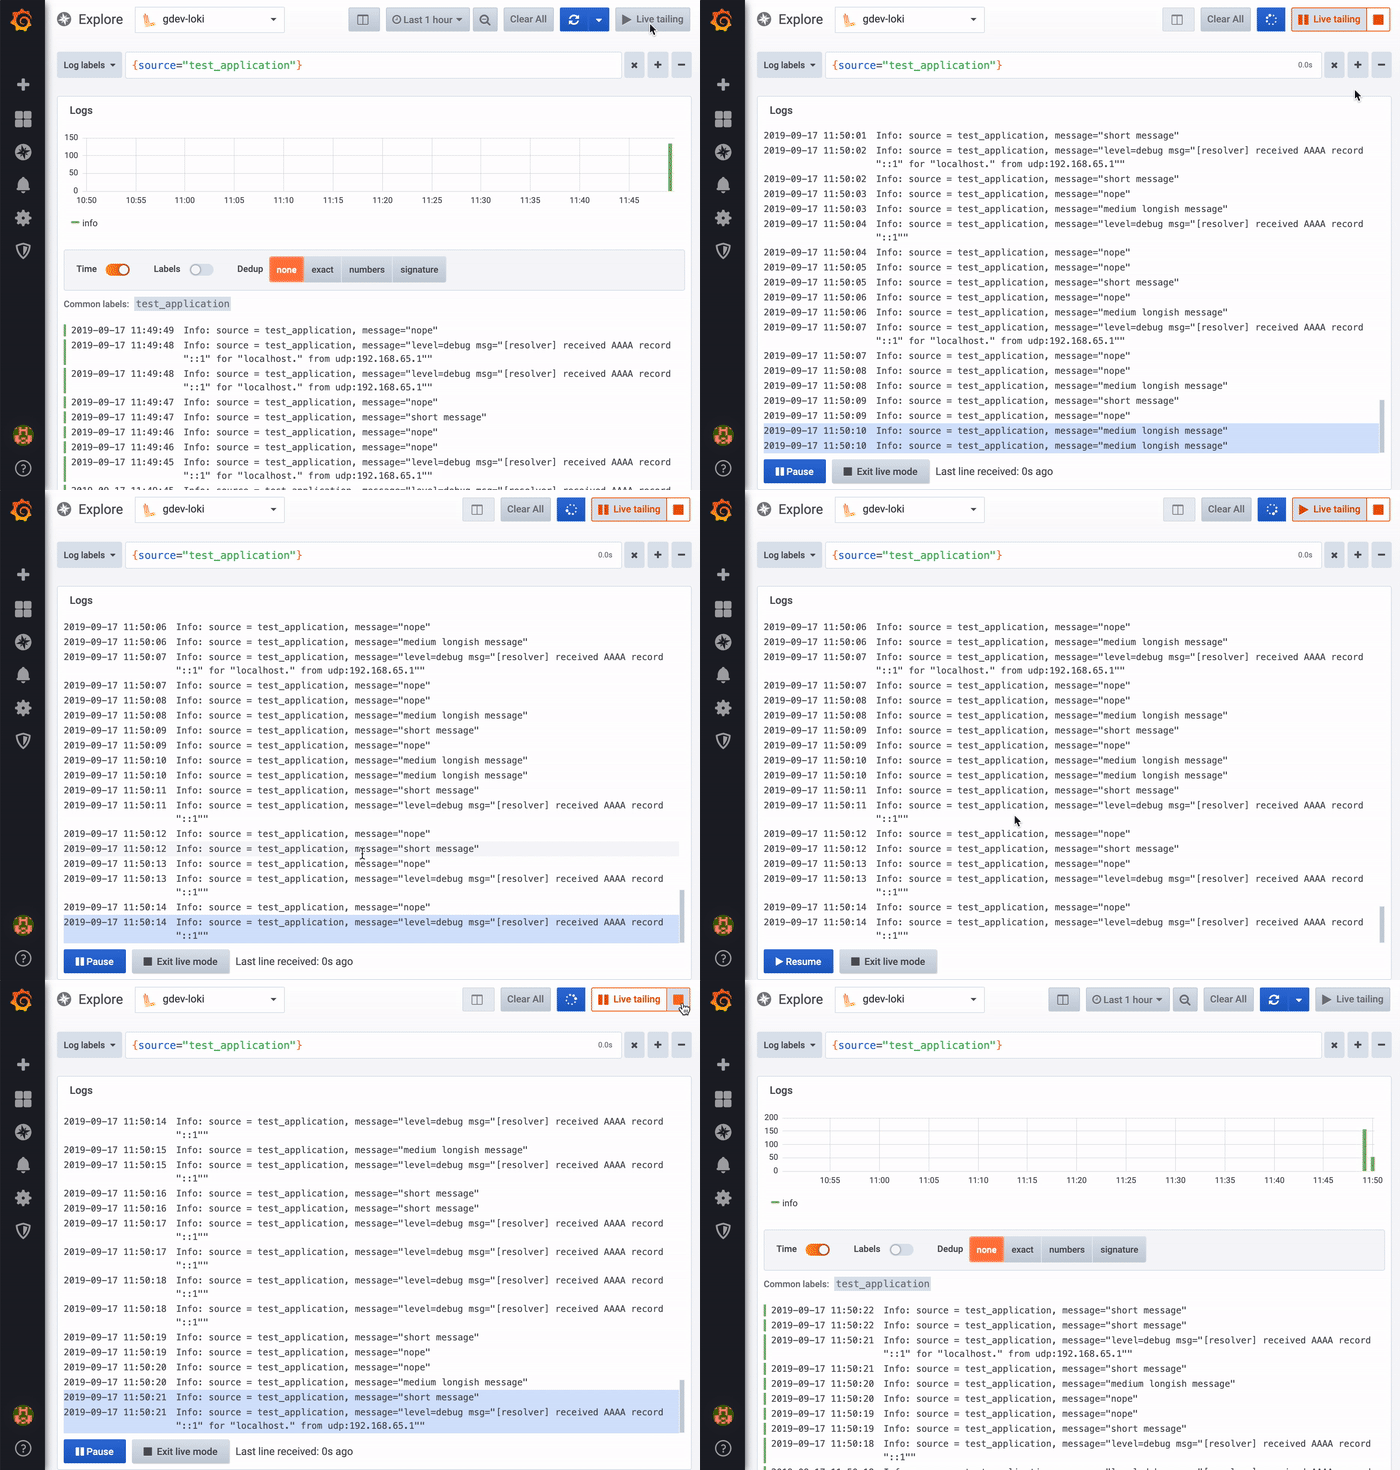
Use the Live tailing feature to see real-time logs on supported data sources.
Click the Live button in the Explore toolbar to switch to Live tail view.
While in Live tail view new logs will come from the bottom of the screen and will have fading contrasting background so you can keep track of what is new. Click the Pause button or scroll the the logs view to pause the Live tailing and explore previous logs without interruption. Click Resume button to resume the Live tailing or click Stop button to exit Live tailing and go back to standard Explore view.

Navigating between Explore and a dashboard
To help accelerate workflows that involve regularly switching from Explore to a dashboard and vice-versa, we’ve added the ability to return to the origin dashboard after navigating to Explore from the panel’s dropdown.

After you’ve navigated to Explore, you should notice a “Back” button in the Explore toolbar.

Simply clicking the button will return you to the origin dashboard, or, if you’d like to bring changes you make in Explore back to the dashboard, simply click the arrow next to the button to reveal a “Return to panel with changes” menu item.


