Important: This documentation is about an older version. It's relevant only to the release noted, many of the features and functions have been updated or replaced. Please view the current version.
Troubleshooting
Visualization & Query issues

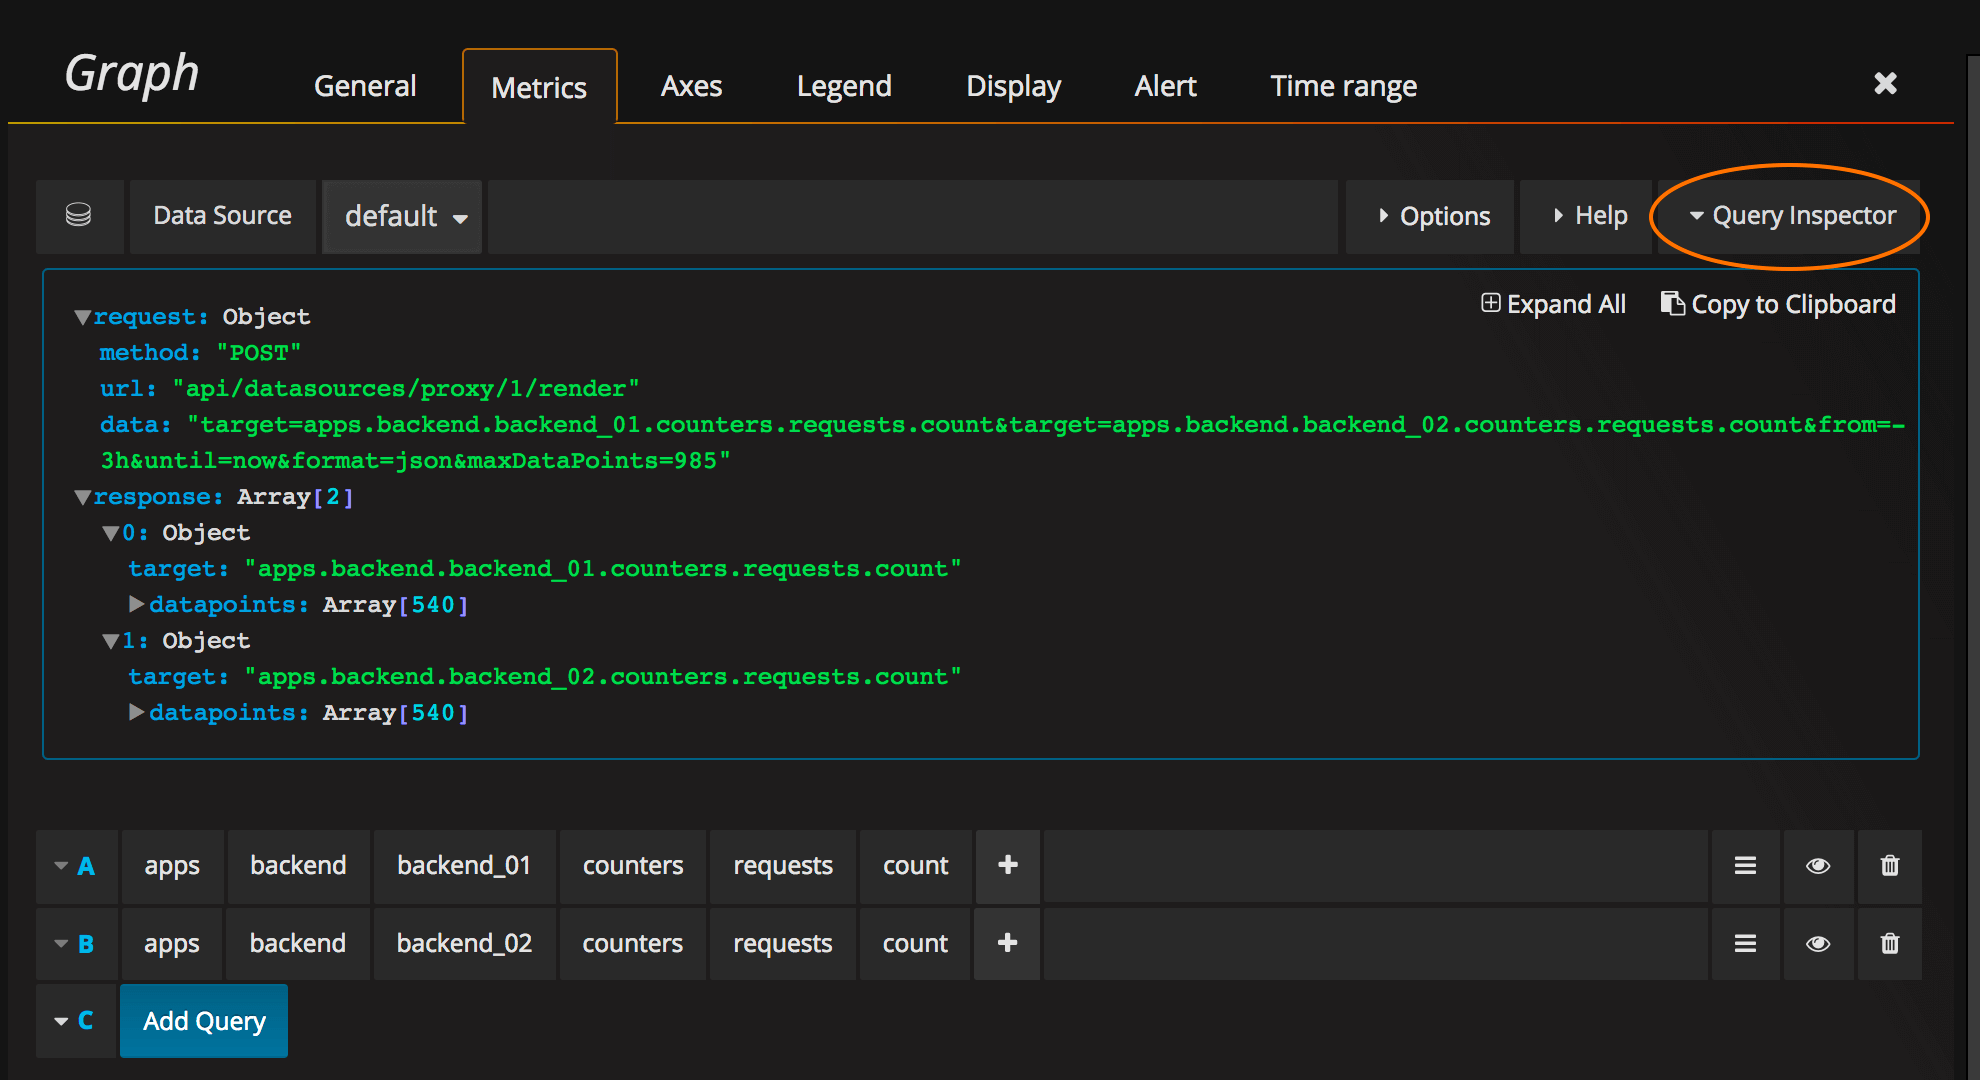
The most common problems are related to the query & response from you data source. Even if it looks like a bug or visualization issue in Grafana it is 99% of time a problem with the data source query or the data source response.
To check this you should use Query Inspector (new in Grafana v4.5). The query Inspector shows query requests and responses.
For more on the query inspector read this guide here. For older versions of Grafana read the how troubleshoot metric query issue article.
Logging
If you encounter an error or problem it is a good idea to check the grafana server log. Usually
located at /var/log/grafana/grafana.log on unix systems or in <grafana_install_dir>/data/log on
other platforms & manual installs.
You can enable more logging by changing log level in you grafana configuration file.
FAQ
Checkout the FAQ section on our community page for frequently asked questions.


