Important: This documentation is about an older version. It's relevant only to the release noted, many of the features and functions have been updated or replaced. Please view the current version.
What’s New in Grafana v6.1
Highlights
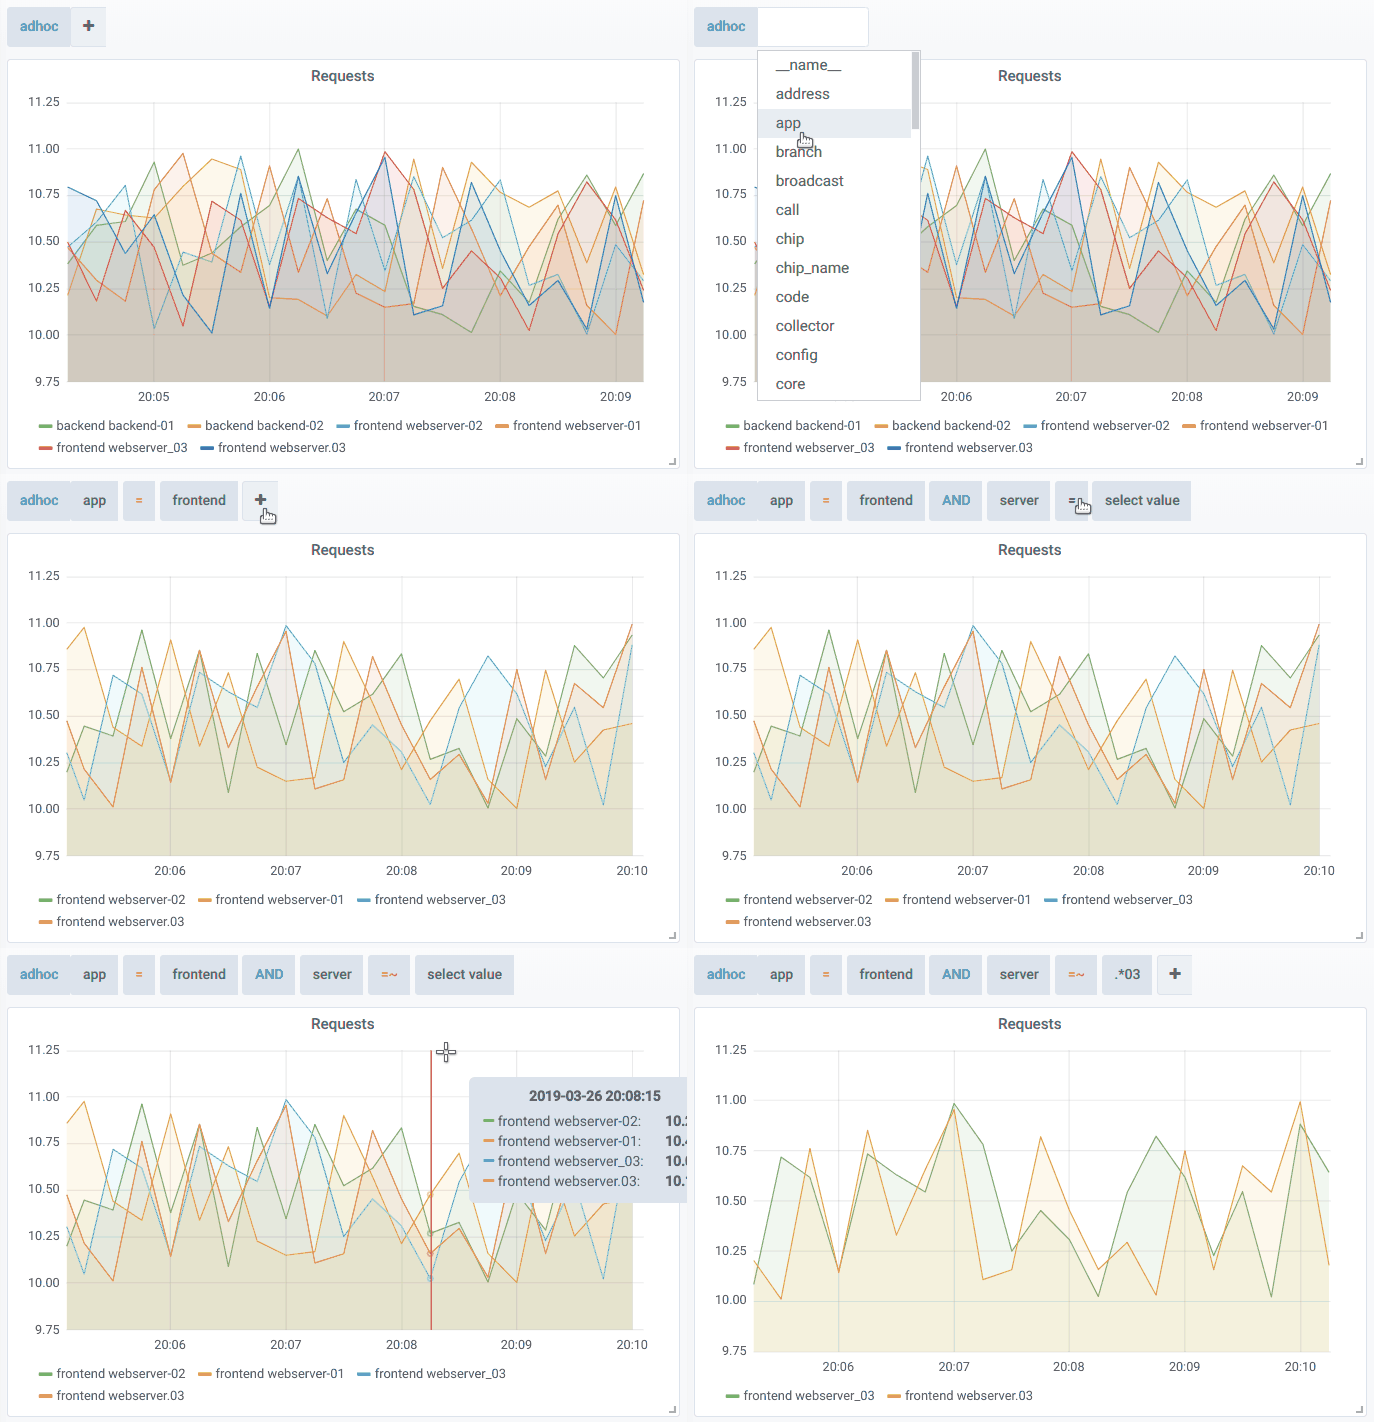
Ad hoc Filtering for Prometheus

The ad hoc filter feature allows you to create new key/value filters on the fly with autocomplete for both key and values. The filter condition is then automatically applied to all queries on the dashboard. This makes it easier to explore your data in a dashboard without changing queries and without having to add new template variables.
Other timeseries databases with label-based query languages have had this feature for a while. Recently Prometheus added support for fetching label names from their API and thanks to Mitsuhiro Tanda implementing it in Grafana, the Prometheus datasource finally supports ad hoc filtering.
Support for fetching a list of label names was released in Prometheus v2.6.0 so that is a requirement for this feature to work in Grafana.
Permissions: Editors can own dashboards, folders and teams they create
When the dashboard folders feature and permissions system was released in Grafana 5.0, users with the editor role were not allowed to administrate dashboards, folders or teams. In the 6.1 release, we have added a config option that can change the default permissions so that editors are admins for any Dashboard, Folder or Team they create.
This feature also adds a new Team permission that can be assigned to any user with the editor or viewer role and enables that user to add other users to the Team.
We believe that this is more in line with the Grafana philosophy, as it will allow teams to be more self-organizing. This option will be made permanent if it gets positive feedback from the community so let us know what you think in the issue on GitHub.
To turn this feature on add the following config option to your Grafana ini file in the users section and then restart the Grafana server:
[users]
editors_can_admin = true
List and revoke of user auth tokens in the API
As the first step of a feature to be able to list a user’s signed in devices/sessions and to be able log out those devices from the Grafana UI, support has been added to the API to list and revoke user authentication tokens.
Minor Features and Fixes
This release contains a lot of small features and fixes:
- A new keyboard shortcut
d ltoggles all Graph legends in a dashboard. - A small bug fix for Elasticsearch - template variables in the alias field now work properly.
- Some new capabilities have been added for datasource plugins that will be of interest to plugin authors:
- a new oauth pass-through option.
- it is now possible to add user details to requests sent to the dataproxy.
- Heatmap and Explore fixes.
Checkout the CHANGELOG.md file for a complete list of new features, changes, and bug fixes.
A huge thanks to our community for all the reported issues, bug fixes and feedback.


