
Important: This documentation is about an older version. It's relevant only to the release noted, many of the features and functions have been updated or replaced. Please view the current version.
Using AWS CloudWatch in Grafana
Grafana ships with built in support for CloudWatch. You just have to add it as a data source and you will be ready to build dashboards for your CloudWatch metrics.
Adding the data source to Grafana
- Open the side menu by clicking the Grafana icon in the top header.
- In the side menu under the
Dashboardslink you should find a link namedData Sources. - Click the
+ Add data sourcebutton in the top header. - Select
Cloudwatchfrom the Type dropdown.
NOTE: If at any moment you have issues with getting this datasource to work and Grafana is giving you undescriptive errors then don’t forget to check your log file (try looking in /var/log/grafana/grafana.log).
Authentication
IAM Roles
Currently all access to CloudWatch is done server side by the Grafana backend using the official AWS SDK. If your Grafana server is running on AWS you can use IAM Roles and authentication will be handled automatically.
Checkout AWS docs on IAM Roles
IAM Policies
Grafana needs permissions granted via IAM to be able to read CloudWatch metrics and EC2 tags/instances/regions. You can attach these permissions to IAM roles and utilize Grafana’s built-in support for assuming roles.
Here is a minimal policy example:
{
    "Version": "2012-10-17",
    "Statement": [
        {
            "Sid": "AllowReadingMetricsFromCloudWatch",
            "Effect": "Allow",
            "Action": [
                "cloudwatch:ListMetrics",
                "cloudwatch:GetMetricStatistics",
                "cloudwatch:GetMetricData"
            ],
            "Resource": "*"
        },
        {
            "Sid": "AllowReadingTagsInstancesRegionsFromEC2",
            "Effect": "Allow",
            "Action": [
                "ec2:DescribeTags",
                "ec2:DescribeInstances",
                "ec2:DescribeRegions"
            ],
            "Resource": "*"
        },
        {
            "Sid": "AllowReadingResourcesForTags",
            "Effect" : "Allow",
            "Action" : "tag:GetResources",
            "Resource" : "*"
        }
    ]
}
AWS credentials file
Create a file at ~/.aws/credentials. That is the HOME path for user running grafana-server.
> NOTE: If you think you have the credentials file in the right place but it is still not working then you might try moving your .aws file to ‘/usr/share/grafana/’ and make sure your credentials file has at most 0644 permissions.
Example content:
[default]
aws_access_key_id = asdsadasdasdasd
aws_secret_access_key = dasdasdsadasdasdasdsa
region = us-west-2
Metric Query Editor
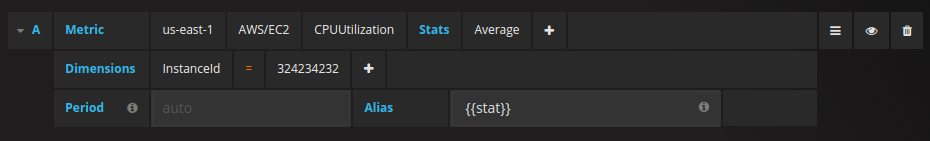
You need to specify a namespace, metric, at least one stat, and at least one dimension.
Templated queries
Instead of hard-coding things like server, application and sensor name in you metric queries you can use variables in their place. Variables are shown as dropdown select boxes at the top of the dashboard. These dropdowns makes it easy to change the data being displayed in your dashboard.
Checkout the Templating documentation for an introduction to the templating feature and the different types of template variables.
Query variable
CloudWatch Datasource Plugin provides the following queries you can specify in the Query field in the Variable
edit view. They allow you to fill a variable’s options list with things like region, namespaces, metric names
and dimension keys/values.
In place of region you can specify default to use the default region configured in the datasource for the query,
e.g. metrics(AWS/DynamoDB, default) or dimension_values(default, ..., ..., ...).
Read more about the available dimensions in the CloudWatch Metrics and Dimensions Reference.
For details about the metrics CloudWatch provides, please refer to the CloudWatch documentation.
Examples templated Queries
Example dimension queries which will return list of resources for individual AWS Services:
ec2_instance_attribute examples
JSON filters
The ec2_instance_attribute query takes filters in JSON format.
You can specify pre-defined filters of ec2:DescribeInstances.
Note that the actual filtering takes place on Amazon’s servers, not in Grafana.
Filters syntax:
{ filter_name1: [ filter_value1 ], filter_name2: [ filter_value2 ] }Example ec2_instance_attribute() query
ec2_instance_attribute(us-east-1, InstanceId, { "tag:Environment": [ "production" ] })Selecting Attributes
Only 1 attribute per instance can be returned. Any flat attribute can be selected (i.e. if the attribute has a single value and isn’t an object or array). Below is a list of available flat attributes:
AmiLaunchIndexArchitectureClientTokenEbsOptimizedEnaSupportHypervisorIamInstanceProfileImageIdInstanceIdInstanceLifecycleInstanceTypeKernelIdKeyNameLaunchTimePlatformPrivateDnsNamePrivateIpAddressPublicDnsNamePublicIpAddressRamdiskIdRootDeviceNameRootDeviceTypeSourceDestCheckSpotInstanceRequestIdSriovNetSupportSubnetIdVirtualizationTypeVpcId
Tags can be selected by prepending the tag name with Tags.
Example ec2_instance_attribute() query
ec2_instance_attribute(us-east-1, Tags.Name, { "tag:Team": [ "sysops" ] })Using json format template variables
Some of query takes JSON format filter. Grafana support to interpolate template variable to JSON format string, it can use as filter string.
If env = 'production', 'staging', following query will return ARNs of EC2 instances which Environment tag is production or staging.
resource_arns(us-east-1, ec2:instance, {"Environment":${env:json}})Cost
Amazon provides 1 million CloudWatch API requests each month at no additional charge. Past this, it costs $0.01 per 1,000 GetMetricStatistics or ListMetrics requests. For each query Grafana will issue a GetMetricStatistics request and every time you pick a dimension in the query editor Grafana will issue a ListMetrics request.
Configure the Datasource with Provisioning
It’s now possible to configure datasources using config files with Grafana’s provisioning system. You can read more about how it works and all the settings you can set for datasources on the provisioning docs page
Here are some provisioning examples for this datasource.
Using a credentials file
apiVersion: 1

datasources:
  - name: Cloudwatch
    type: cloudwatch
    jsonData:
      authType: credentials
      defaultRegion: eu-west-2
Using accessKey and secretKey
apiVersion: 1

datasources:
  - name: Cloudwatch
    type: cloudwatch
    jsonData:
      authType: keys
      defaultRegion: eu-west-2
    secureJsonData:
      accessKey: "<your access key>"
      secretKey: "<your secret key>"

