Important: This documentation is about an older version. It's relevant only to the release noted, many of the features and functions have been updated or replaced. Please view the current version.
Alert Notifications
Alerting is only available in Grafana v4.0 and above.
When an alert changes state it sends out notifications. Each alert rule can have
multiple notifications. But in order to add a notification to an alert rule you first need
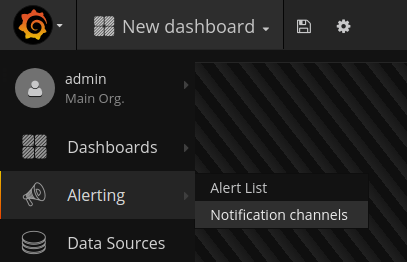
to add and configure a notification channel (can be email, Pagerduty or other integration). This is done from the Notification Channels page.
Notification Channel Setup

On the Notification Channels page hit the New Channel button to go the the page where you
can configure and setup a new Notification Channel.
You specify name and type, and type specific options. You can also test the notification to make sure it’s working and setup correctly.
Send on all alerts
When checked this option will make this notification used for all alert rules, existing and new.
Supported Notification Types
Grafana ships with the following set of notification types:
To enable email notification you have to setup SMTP settings in the Grafana config. Email notification will upload an image of the alert graph to an external image destination if available or fallback to attaching the image in the email.
Slack

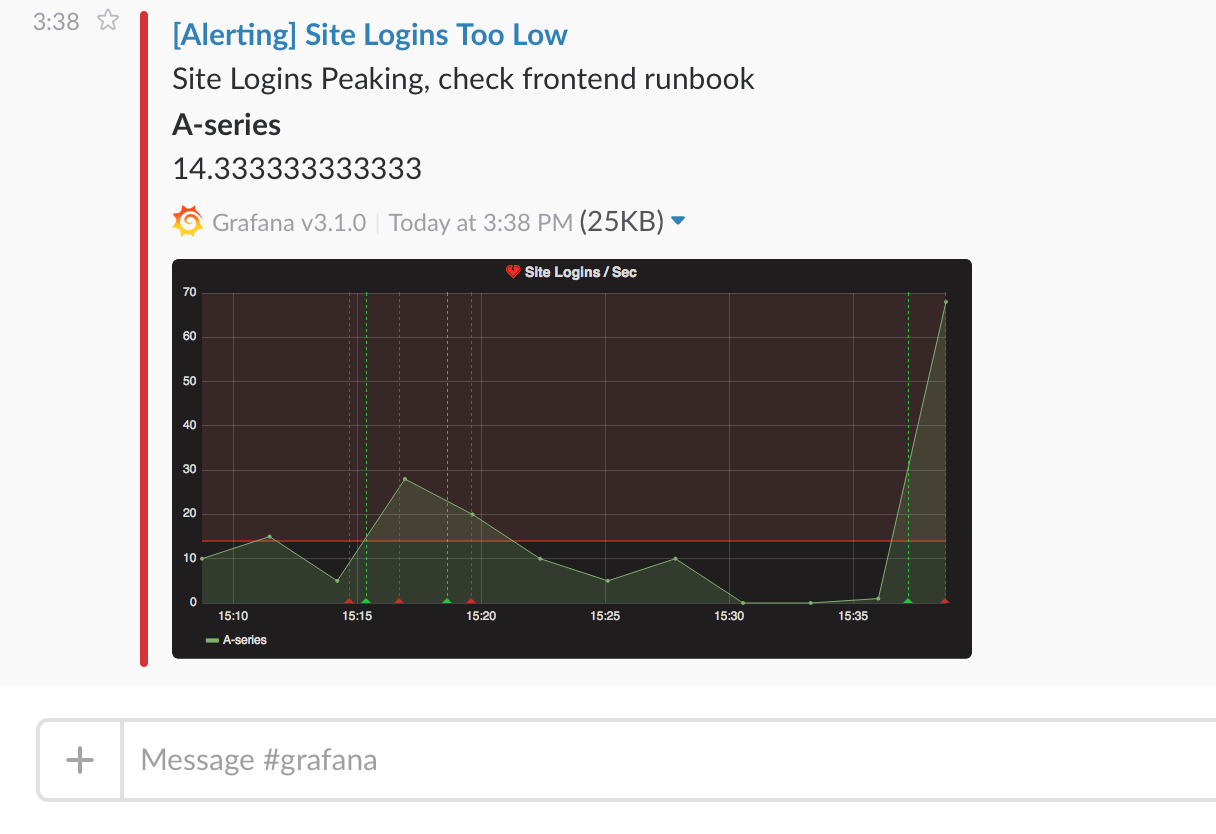
To set up slack you need to configure an incoming webhook url at slack. You can follow their guide for how to do that https://api.slack.com/incoming-webhooks If you want to include screenshots of the firing alerts in the slack messages you have to configure the external image destination in Grafana.
PagerDuty
To set up PagerDuty, all you have to do is to provide an api key.
Webhook
The webhook notification is a simple way to send information about an state change over HTTP to a custom endpoint. Using this notification you could integrate Grafana into any system you choose, by yourself.
Example json body:
{
  "title": "My alert",
  "ruleId": 1,
  "ruleName": "Load peaking!",
  "ruleUrl": "http://url.to.grafana/db/dashboard/my_dashboard?panelId=2",
  "state": "alerting",
  "imageUrl": "http://s3.image.url",
  "message": "Load is peaking. Make sure the traffic is real and spin up more webfronts",
  "evalMatches": [
    {
      "metric": "requests",
      "tags": {},
      "value": 122
    }
  ]
}- state - The possible values for alert state are:
ok,paused,alerting,pending,no_data.
Other Supported Notification Channels
Grafana also supports the following Notification Channels:
HipChat
VictorOps
Sensu
OpsGenie
Threema
Pushover
Telegram
LINE
Enable images in notifications
Grafana can render the panel associated with the alert rule and include that in the notification. Most Notification Channels require that this image be publicly accessible (Slack and PagerDuty for example). In order to include images in alert notifications, Grafana can upload the image to an image store. It currently supports Amazon S3 and Webdav for this. So to set that up you need to configure the external image uploader in your grafana-server ini config file.
Currently only the Email Channels attaches images if no external image store is specified. To include images in alert notifications for other channels then you need to set up an external image store.
This is an optional requirement, you can get Slack and email notifications without setting this up.
Configure the link back to Grafana from alert notifications
All alert notifications contains a link back to the triggered alert in the Grafana instance. This url is based on the domain setting in Grafana.


