Important: This documentation is about an older version. It's relevant only to the release noted, many of the features and functions have been updated or replaced. Please view the current version.
What’s New in Grafana v2.0
Grafana 2.0 represents months of work by the Grafana team and the community. We are pleased to be able to release the Grafana 2.0 beta. This is a guide that describes some of changes and new features that can be found in Grafana V2.0.
If you are interested in how to migrate from Grafana V1.x to V2.0, please read our Migration Guide
New backend server
Grafana now ships with its own required backend server. Also completely open-source, it’s written in Go and has a full HTTP API.
In addition to new features, the backend server makes it much easier to set up and enjoy Grafana. Grafana 2.0 now ships as cross platform binaries with no dependencies. Authentication is built in, and Grafana is now capable of proxying connections to Data Sources. There are no longer any CORS (Cross Origin Resource Sharing) issues requiring messy workarounds. Elasticsearch is no longer required just to store dashboards.
User & Organization permissions
All Dashboards and Data Sources are linked to an Organization (not to a User). Users are linked to Organizations via a role. That role can be:
Viewer: Can only view dashboards, not save / create them.Editor: Can view, update and create dashboards.Admin: Everything an Editor can plus edit and add data sources and organization users.
Note A
Viewercan still view all metrics exposed through a data source, not only the metrics used in already existing dashboards. That is because there are not per series permissions in Graphite, InfluxDB or OpenTSDB.
There are currently no permissions on individual dashboards.
Read more about Grafanas new user model on the Admin section
Dashboard Snapshot sharing
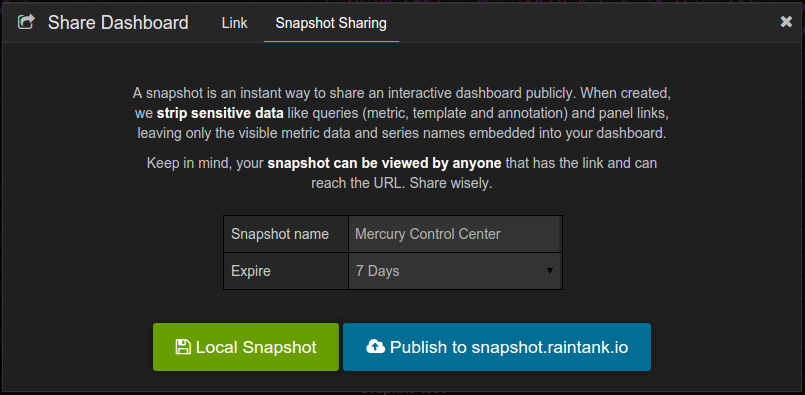
A Dashboard Snapshot is an easy way to create and share a URL for a stripped down, point-in-time version of any Dashboard. You can give this URL to anyone or everyone, and they can view the Snapshot even if they’re not a User of your Grafana instance.
You can set an expiration time for any Snapshots you create. When you create a Snapshot, we strip sensitive data, like panel metric queries, annotation and template queries and panel links. The data points displayed on screen for that specific time period in your Dashboard is saved in the JSON of the Snapshot itself.
Sharing a Snapshot is similar to sharing a link to a screenshot of your dashboard, only way better (they’ll look great at any screen resolution, you can hover over series, even zoom in). Also they are fast to load as they aren’t actually connected to any live Data Sources in any way.
They’re a great way to communicate about a particular incident with specific people who aren’t Users of your Grafana instance. You can also use them to show off your dashboards over the Internet.
Publish snapshots
You can publish snapshots locally or to snapshot.raintank.io. snapshot.raintank is a free service provided by raintank for hosting external Grafana snapshots.
Either way, anyone with the link (and access to your Grafana instance for local snapshots) can view it.
Panel time overrides & timeshift
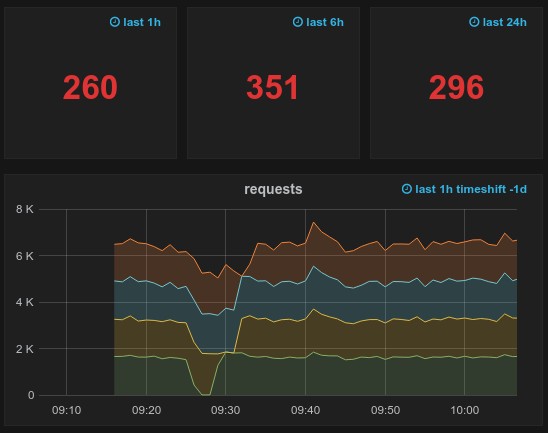
In Grafana v2.x you can now override the relative time range for individual panels, causing them to be different than what is selected in the Dashboard time picker in the upper right. You can also add a time shift to individual panels. This allows you to show metrics from different time periods or days at the same time.
You control these overrides in panel editor mode and the new tab Time Range.
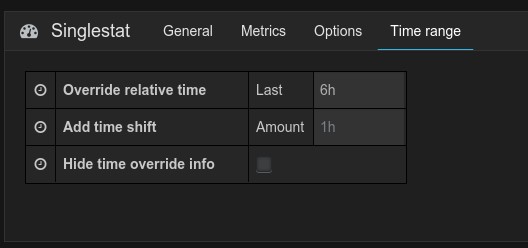
When you zoom or change the Dashboard time to a custom absolute time range, all panel overrides will be disabled. The panel relative time override is only active when the dashboard time is also relative. The panel timeshift override however is always active, even when the dashboard time is absolute.
The Hide time override info option allows you to hide the the override info text that is by default shown in the
upper right of a panel when overridden time range options.
Currently you can only override the dashboard time with relative time ranges, not absolute time ranges.
Panel iframe embedding
You can embed a single panel on another web page or your own application using the panel share dialog.
Below you should see an iframe with a graph panel (taken from a Dashboard snapshot at snapshot.raintank.io.
Try hovering or zooming on the panel below!
This feature makes it easy to include interactive visualizations from your Grafana instance anywhere you want.
New dashboard top header
The top header has gotten a major streamlining in Grafana V2.0.

Side menubar toggleToggle the side menubar on or off. This allows you to focus on the data presented on the Dashboard. The side menubar provides access to features unrelated to a Dashboard such as Users, Organizations, and Data Sources.Dashboard dropdownThe main dropdown shows you which Dashboard you are currently viewing, and allows you to easily switch to a new Dashboard. From here you can also create a new Dashboard, Import existing Dashboards, and manage the Playlist.Star Dashboard: Star (or un-star) the current Dashboard. Starred Dashboards will show up on your own Home Dashboard by default, and are a convenient way to mark Dashboards that you’re interested in.Share Dashboard: Share the current dashboard by creating a link or create a static Snapshot of it. Make sure the Dashboard is saved before sharing.Save dashboard: Save the current Dashboard with the current name.Settings: Manage Dashboard settings and features such as Templating, Annotations and the name.
Note In Grafana v2.0 when you change the title of a dashboard and then save it it will no longer create a new Dashboard. It will just change the name for the current Dashboard. To change name and create a new Dashboard use the
Save As...menu option
New Side menubar
The new side menubar provides access to features such as User Preferences, Organizations, and Data Sources.
If you have multiple Organizations, you can easily switch between them here.
The side menubar will become more useful as we build out additional functionality in Grafana 2.x
You can easily collapse or re-open the side menubar at any time by clicking the Grafana icon in the top left. We never want to get in the way of the data.
New search view & starring dashboards

The dashboard search view has gotten a big overhaul. You can now see and filter by which dashboard you have personally starred.
Logarithmic scale
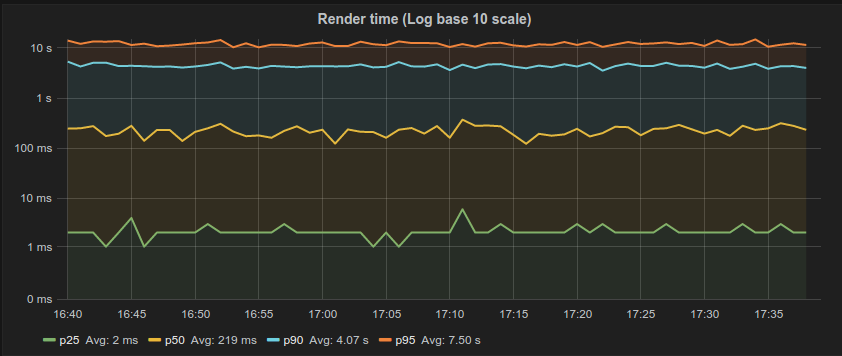
The Graph panel now supports 3 logarithmic scales, log base 10, log base 32, log base 1024. Logarithmic y-axis scales are very useful when rendering many series of different order of magnitude on the same scale (eg.
latency, network traffic, and storage)
Dashlist panel

The dashlist is a new panel in Grafana v2.0. It allows you to show your personal starred dashboards, as well as do custom searches based on search strings or tags.
dashlist is used on the new Grafana Home screen. It is included as a reference Panel and is useful to provide basic linking between Dashboards.
Data Source proxy & admin views
Data sources in Grafana v2.0 are no longer defined in a config file. Instead, they are added through the UI or the HTTP API.
The backend can now proxy data from Data Sources, which means that it is a lot easier to get started using Grafana with Graphite or OpenTSDB without having to spend time with CORS (Cross origin resource sharing) work-arounds.
In addition, connections to Data Sources can be better controlled and secured, and authentication information no longer needs to be exposed to the browser.
Dashboard “now delay”
A commonly reported problem has been graphs dipping to zero at the the end, because metric data for the last interval has yet to be written to the Data Source. These graphs then “self correct” once the data comes in, but can look deceiving or alarming at times.
You can avoid this problem by adding a now delay in Dashboard Settings > Time Picker tab. This new feature will cause Grafana to ignore the most recent data up to the set delay.

The delay that may be necessary depends on how much latency you have in your collection pipeline.
Dashboard overwrite protection
Grafana v2.0 protects Users from accidentally overwriting each others Dashboard changes. Similar protections are in place if you try to create a new Dashboard with the same name as an existing one.

These protections are only the first step; we will be building out additional capabilities around dashboard versioning and management in future versions of Grafana.
User preferences
If you open side menu (by clicking on the Grafana icon in the top header) you can access your Profile Page.
Here you can update your user details, UI Theme, and change your password.
Server-side Panel rendering
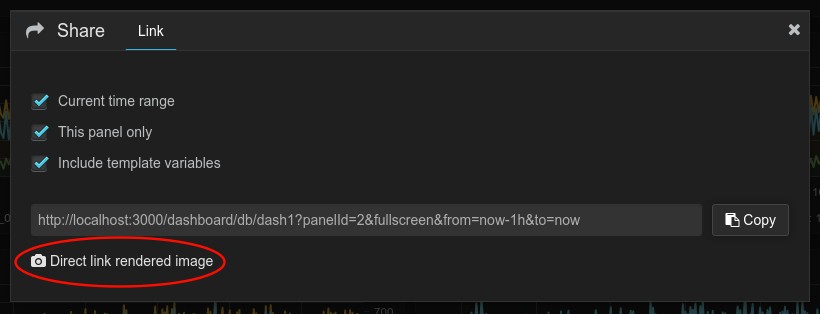
Grafana now supports server-side PNG rendering. From the Panel share dialog you now have access to a link that will render a particular Panel to a PNG image.
Note This requires that your Data Source is accessible from your Grafana instance.
