
Important: This documentation is about an older version. It's relevant only to the release noted, many of the features and functions have been updated or replaced. Please view the current version.
Traces Drilldown UI reference
Grafana Traces Drilldown helps you focus your tracing data exploration. Some sections change based on the metric you choose. For details on workflows, refer to Analyze tracing data.
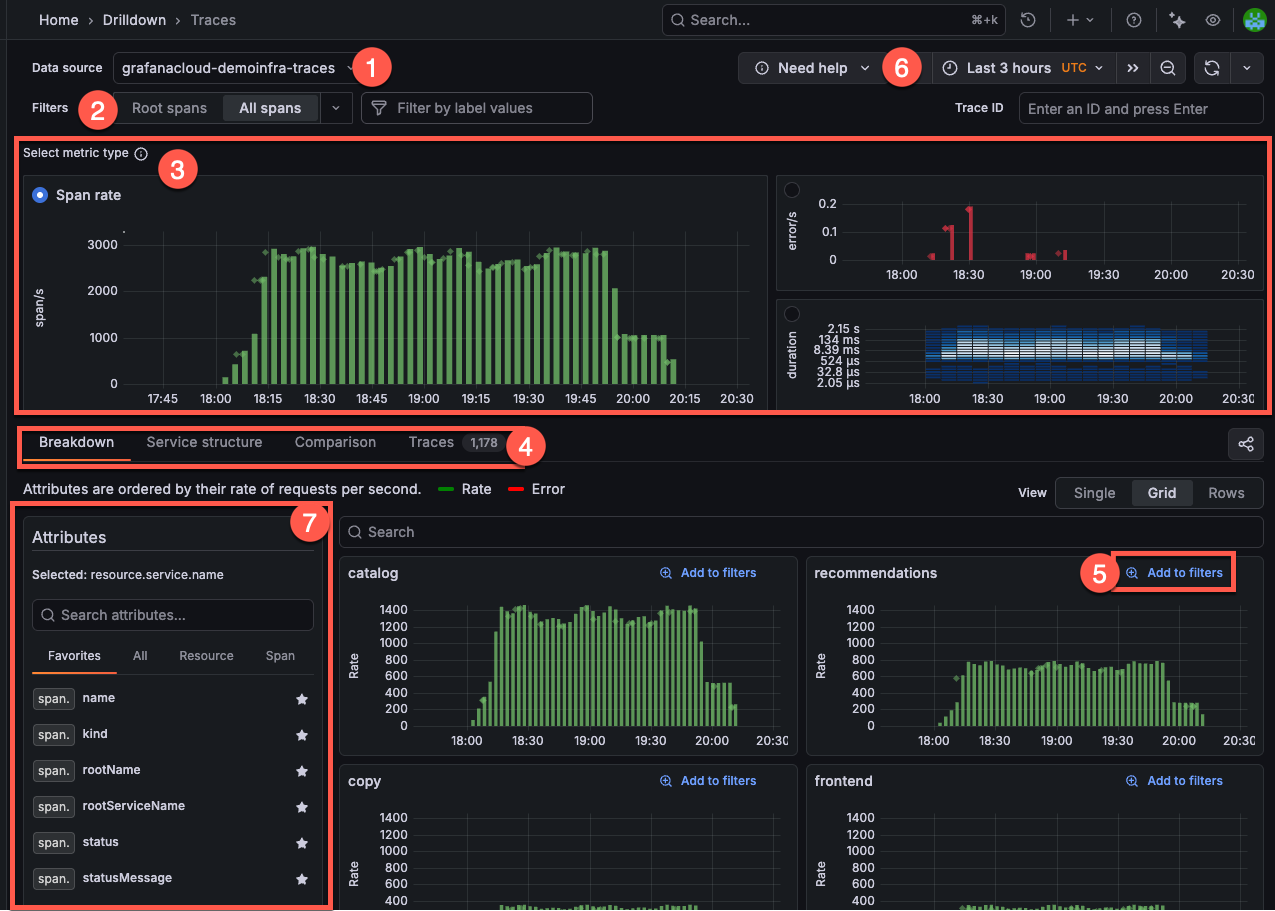
Data source selection: At the top left, you select the data source for your traces. In this example, the data source is set to
grafanacloud-traces.Filters: The filter bar helps you refine the data displayed. You can select the type of trace data, either Root spans or All spans. You can also add specific label values to narrow the scope of your investigation.
Select metric type: Choose between Rate, Errors, or Duration metrics. In this example, the Rate metric is selected, showing the number of spans per second.
- The Rate graph (top left) shows the rate of spans over time.
- The Errors graph (top right) displays the error rate over time, with red bars indicating errors.
- The Duration heatmap (bottom right) visualizes the distribution of span durations and can help identify latency patterns.
Investigation-focused tabs: Each metric type has its own set of tabs that help you explore your tracing data. These tabs differ depending on the metric type you’ve selected. For example, when you use Rate, the investigation tabs show Breakdown, Service structure, Comparison, and Traces.
- Exceptions (Errors only): Group exception messages with counts, trend sparkline, emitting service, and last-seen.
- Percentiles (Duration only): Choose
p50,p75,p90,p95,p99for Duration views. Default:p90. If you clear all,p90applies automatically.
Add to filters: Each attribute group includes an Add to filters option, so you can add your selections into the current investigation.
Time range selector: At the top right, you can adjust the time range for displayed data using the time picker. In this example, the time range is set to the last 24 hours. Refer to Set dashboard time range for more information.
You can also open a specific trace by ID by entering the trace ID into the Trace ID input and pressing Enter. Refer to Open a trace by ID for more information.
Attributes sidebar: Use the Attributes sidebar to select and manage attributes across views. Search attributes with regular expressions. Press Escape or click Clear to reset the search.
Click the star icon to add or remove a favorite. Drag and drop favorites to reorder them. Switch between scopes: Favorites, All, Resource, Span. A filter icon marks attributes already applied in the Filters bar.
In Breakdown and Comparison views, selecting an attribute sets the current Group by attribute. In Trace list view, select multiple attributes to add or remove table columns. The app saves favorites in your browser.
Query result streaming
When you first open Traces Drilldown, you may notice a green dot on the upper right corner of any of the metrics graphs.
This green dot indicates that Traces Drilldown is displaying data that’s still being received, or streamed. Streaming lets you view partial query results before the entire query completes.
Open in Explore app
You can open a trace in the Explore app by clicking the Open in Explore button. This opens the trace in the Explore app, where you can use the full power of Explore to analyze the trace.
If you’re using Explore, you can open a trace in Traces Drilldown by clicking the Open in Traces Drilldown button.


