Important: This documentation is about an older version. It's relevant only to the release noted, many of the features and functions have been updated or replaced. Please view the current version.
View exemplars
Exemplars connect your high-level metric trends to the individual traces that caused them, making it much faster to move from “something’s wrong” to “here’s exactly what happened.”
An exemplar is a specific trace representative of measurement taken in a given time interval. While metrics excel at giving you an aggregated view of your system, traces give you a fine-grained view of a single request; exemplars are a way to link the two.
Use exemplars to help isolate problems within your data distribution by pinpointing query traces exhibiting high latency within a time interval. After you localize the latency problem to a few exemplar traces, you can combine it with additional system based information or location properties to perform a root cause analysis faster, leading to quick resolutions to performance issues.
Think of exemplars as “bookmarks” in your metric data that point to actual traces. When you see a spike in error rates or latency in your metrics, exemplars let you click directly on a specific data point and jump to the actual trace that contributed to that metric.
For more information, refer to Introduction to exemplars.
Exemplars in Traces Drilldown
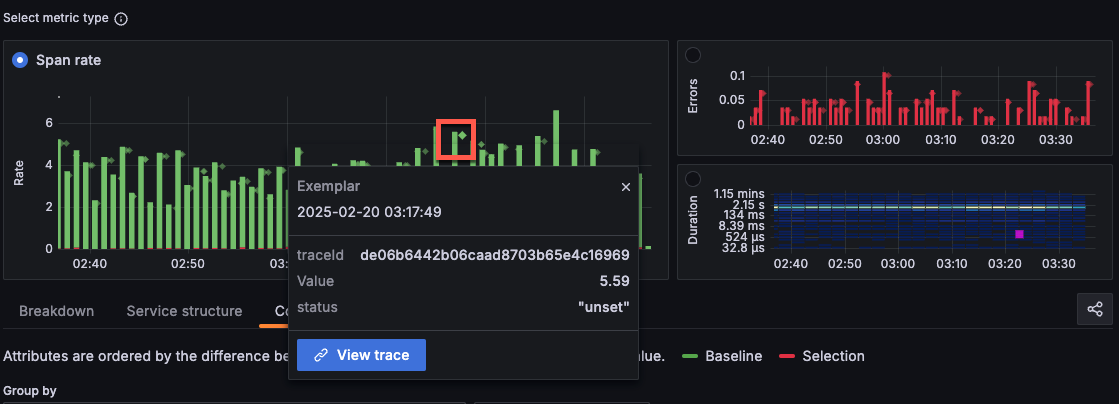
In Traces Drilldown, exemplar data is represented by a small diamond next to the bar graphs. You can view the exemplar information by hovering the cursor over the small diamond.
As you view metrics in the Breakdown, Service structure, or other investigation tabs, look for small diamond icons next to the bar chart metrics.
When you hover your cursor over a diamond, a tooltip appears showing:
- Exemplar details
- Trace information
- Timestamp and metadata
Tip
Not seeing exemplars? Refer to Exemplars in Grafana Cloud for information about how to enable them.
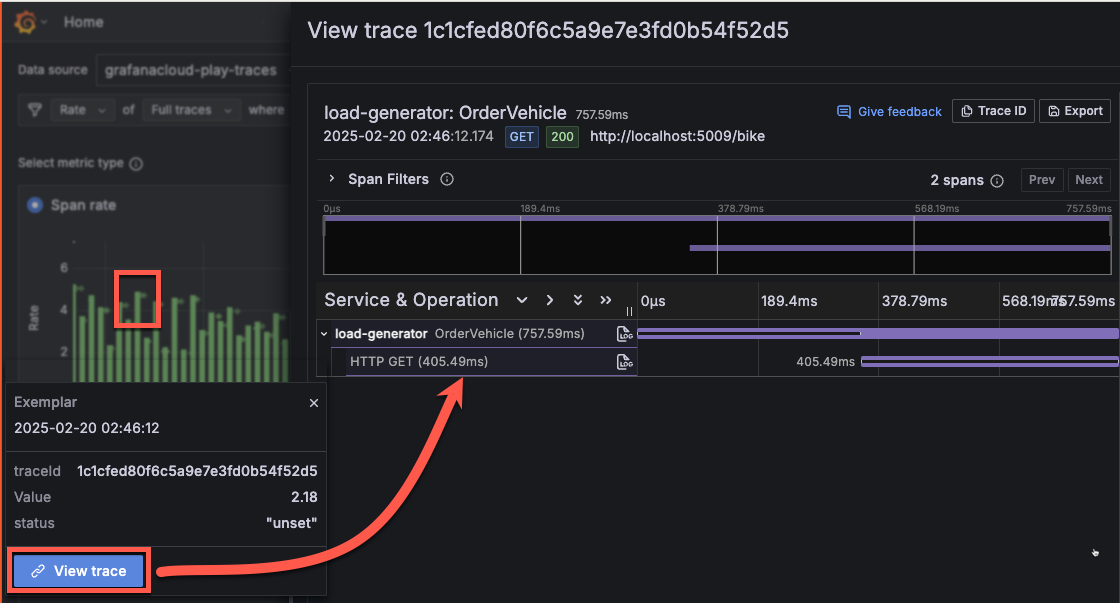
Select View trace to open a slide-out trace panel that displays:
- The full trace that the exemplar represents
- All spans within that trace
- Timing and performance details
- Service relationships