Important: This documentation is about an older version. It's relevant only to the release noted, many of the features and functions have been updated or replaced. Please view the current version.
Logs in Explore
Explore is a powerful tool for logging and log analysis. It allows you to investigate logs from different data sources including:
With Explore, you can efficiently monitor, troubleshoot, and respond to incidents by analyzing your logs and identifying the root causes. It also helps you to correlate logs with other telemetry signals such as metrics, traces or profiles, by viewing them side-by-side.
The results of log queries display as individual log lines and as a graph showing the logs volume for the selected time period.
Logs volume
When working with data sources that support a full range logs volume, Explore automatically displays a graph showing the log distribution for all submitted log queries. This feature is currently supported by the Elasticsearch and Loki data sources.
Note
In Loki, generating the full range log volume via a metric query can be resource-intensive, depending on the time range queried. This is especially challenging for smaller Loki installations. To mitigate this, we recommend that you use a proxy like nginx in front of Loki with a timeout like 10ss. Log volume histogram queries can be identified by looking for queries with the HTTP header
X-Query-Tagswith valueSource=logvolhist; these headers are added by Grafana to all log volume histogram queries.
If the data source doesn’t support loading the full range logs volume, the logs model calculates a time series by counting log rows and organizing them into buckets based on an automatically calculated time interval. The timestamp of the first log row is used to anchor the start of the logs volume in the results. The end of the time series is anchored to the time picker’s To range. This way, you can still analyze and visualize log data efficiently even when the data source doesn’t offer full range support.
Logs
The following sections provide detailed explanations on how to visualize and interact with individual logs in Explore.
Logs navigation
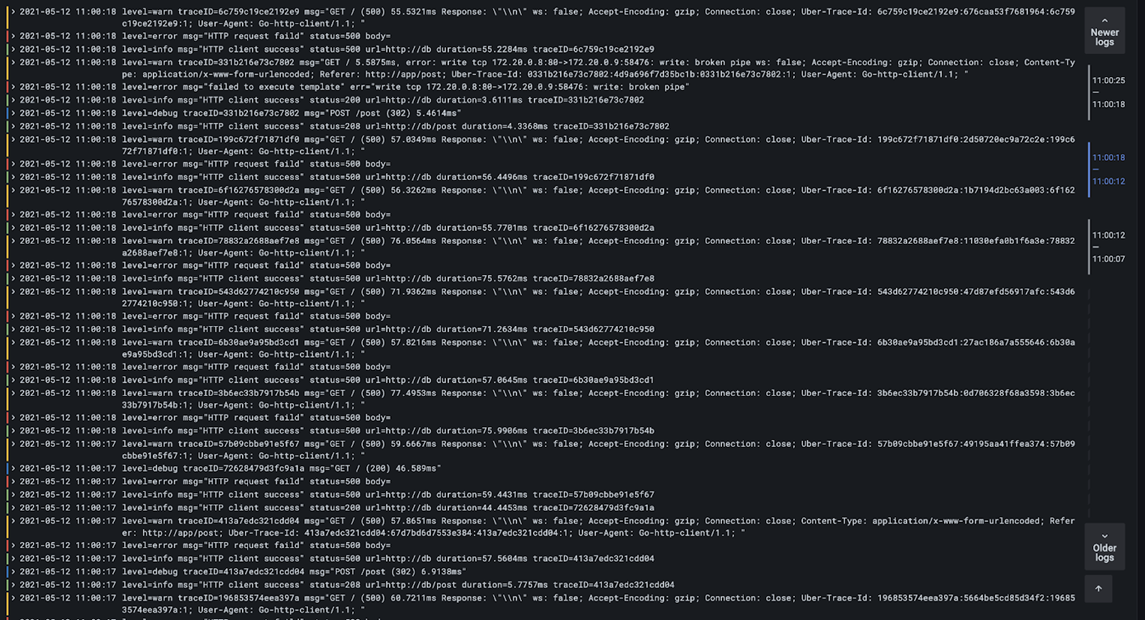
Logs navigation, located at the right side of the log lines, can be used to easily request additional logs by clicking Older logs at the bottom of the navigation. This is especially useful when you reach the line limit and you want to see more logs. Each request run from the navigation displays in the navigation as separate page. Every page shows from and to timestamps of the incoming log lines. You can see previous results by clicking on each page. Explore caches the last five requests run from the logs navigation so you’re not re-running the same queries when clicking on the pages, saving time and resources.

Visualization options
You have the option to customize the display of logs and choose which columns to show. Following is a list of available options.
Download log lines
Click Download to download log results in either TXT or JSON format. This feature allows you to save log data for further analysis or to share it with others in a convenient and accessible format.
Log result meta information
The following meta information displays above the retrieved log lines:
- Number of received logs - Indicates the total count of logs received for the current query or time range.
- Error - Displays any errors in your log results.
- Common labels - Displays common labels.
- Total bytes processed - Represents the cumulative size of the log data processed in bytes.
Note
The availability of certain metadata may vary depending on the data source, so you might only see details related to those specific data sources.
Escaping newlines
Explore automatically detects some incorrectly escaped sequences in log lines, such as newlines (\n, \r) or tabs (\t). When it detects such sequences, Explore provides an Escape newlines option.
To automatically fix incorrectly escaped sequences that Explore has detected:
- Click Escape newlines to replace the sequences.
- Review returned log lines.
Explore replaces these sequences, changing the option from Escape newlines to Remove escaping. Assess the changes, as the parsing may not be accurate based on the input. To revert the replacements, click Remove escaping.
Log level
For logs where a level label is specified, the value of this label is used to determine the log level and update the color of each log line accordingly.
If the log doesn’t have a specified level label, Grafana attempts to determine if its content matches any of the supported expressions.
Refer to the following table for more information. The log level is always determined by the first match. If Grafana isn’t able to infer a log level field, it gets visualized as an unknown log level.
Tip
When using the Loki data source, if
levelis part of your log line, you can use parsers such asjson,logfmt, orregexto extract the level information into a level label. This label is used to determine the level value, allowing the histogram to display the various log levels as separate bars.
Log levels supported and mapping of log level abbreviation and expressions:
Highlight searched words
When your query includes specific words or expressions for keyword search, Explore highlights them in log lines to enhance visibility. This highlighting feature facilitates easier identification and focus on the relevant content within your logs.
Note
The ability to highlight search words varies depending on data source. For some data sources, the highlighting of search words may not be available.
Log details view
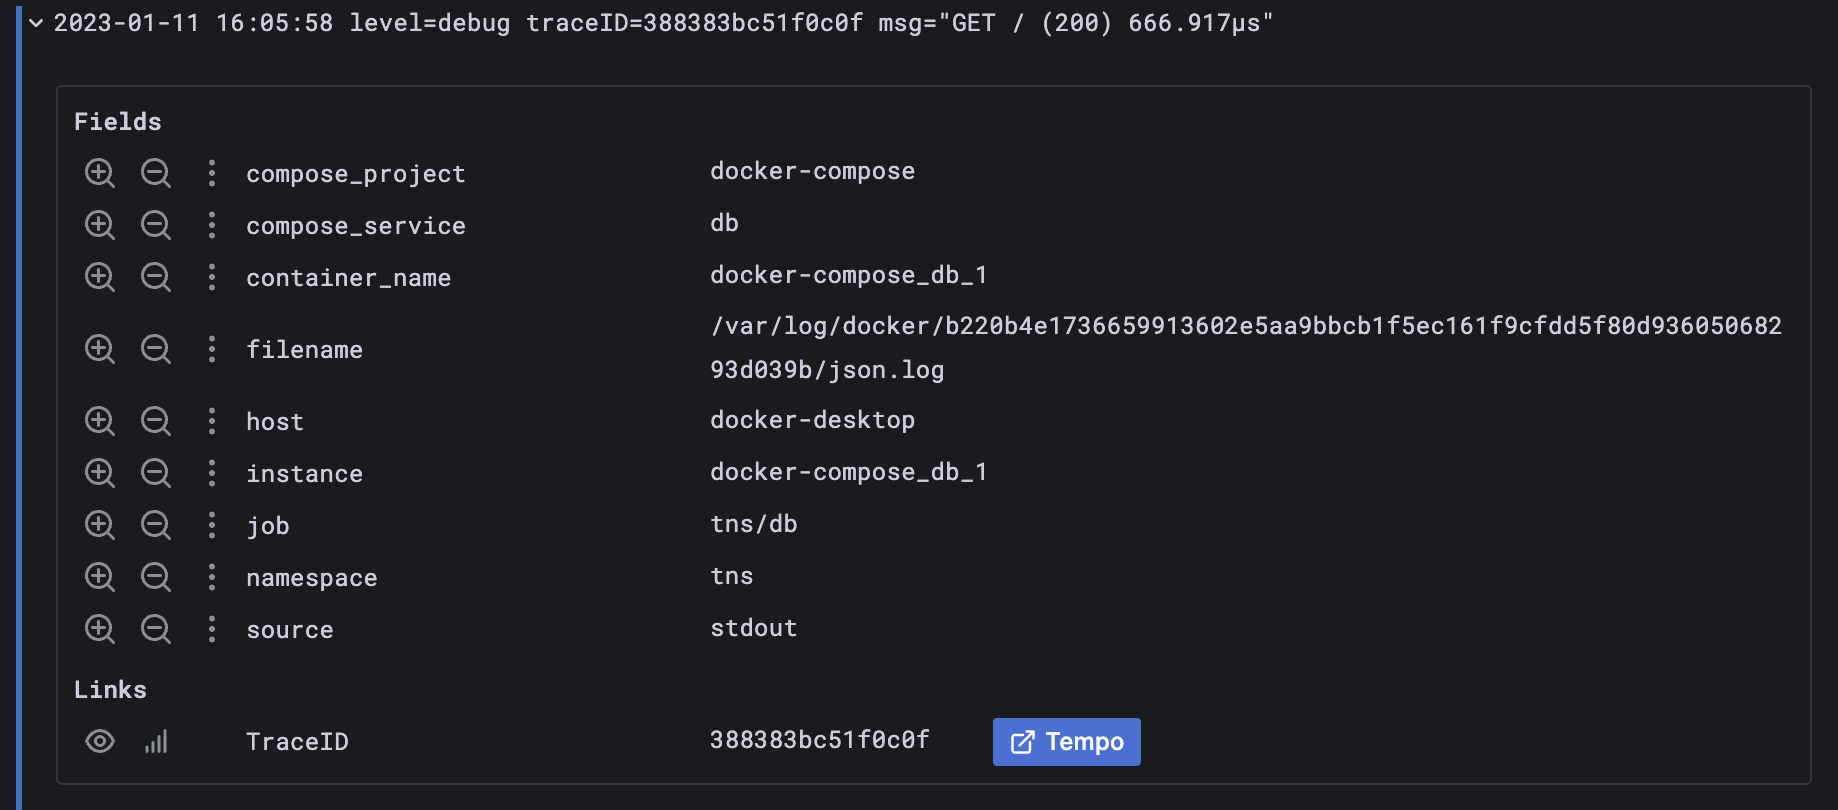
In Explore, each log line has an expandable section called Log details that you open by clicking on the log line. The Log details view provides additional information and exploration options in the form of Fields and Links attached to the log lines, enabling a more robust interaction and analysis.
Fields
Within the Log details view, you have the ability to filter the displayed fields in two ways: a positive filter, which focuses on an specific field and a negative filter, which excludes certain fields. These filters modify the corresponding query that generated the log line, incorporating equality and inequality expressions accordingly.
If the data source supports it, as is the case with Loki and Elasticsearch, log details will verify whether the field is already included in the current query, indicating an active state for positive filters. This enables you to toggle it off from the query or convert the filter expression from positive to negative as necessary.
Click the eye icon to select a subset of fields to visualize in the logs list instead of the complete log line.
Each field has a stats icon, which displays ad-hoc statistics in relation to all displayed logs.
Links
Grafana provides data links or correlations, allowing you to convert any part of a log message into an internal or external link. These links enable you to navigate to related data or external resources, offering a seamless and convenient way to explore additional information.

Log context
Log context is a feature that displays additional lines of context surrounding a log entry that matches a specific search query. This helps in understanding the context of the log entry and is similar to the -C parameter in the grep command.
Toggle Wrap lines if you encounter long lines of text that make it difficult to read and analyze the context around log entries. By enabling this toggle, Grafana automatically wraps long lines of text to fit within the visible width of the viewer, making the log entries easier to read and understand.
Click Open in split view to execute the context query for a log entry in a split screen in the Explore view. Clicking this button opens a new Explore pane with the context query displayed alongside the log entry, making it easier to analyze and understand the surrounding context.
Use Command-click or Ctrl+click to open the log context query in a new browser to view the context model. All previously selected filters get applied.
Copy log line
Click Copy log line to copy the content of a selected log line to the clipboard.
Copy link to log line
Linking log lines in Grafana allows you to quickly navigate to specific log entries for detailed and precise analysis. Click Copy shortlink to generate and copy a short URL that provides direct access to the exact log entry within an absolute time range. When you open the link, Grafana automatically scrolls to the corresponding log line and highlights it in blue, making it easy to identify and focus on relevant information.
Note
The short URL feature is currently only supported in Loki and other data sources that provide an
idfield.
Live tailing
Use the Live tail feature to view real-time logs from data sources.
- Click Live in the Explore toolbar to switch to Live tail view.
- In Live tail view, new logs appear at the bottom of the screen, and have a contrasting background, allowing you to easily track what’s new.
- Click Pause to pause live tailing and explore previous logs without interruptions. or simply scroll through the logs view.
- Click Clear logs to remove all displayed logs. This action resets the log view and provides a clean slate to continue your log analysis
- Click Resume to resume live tailing and continue viewing real-time logs.
- Click Stop to exit live tailing and return to the standard Explore view.
The Live tailing feature allows you to monitor the latest logs in real-time, making it easier to track events as they occur and promptly detect issues.
Logs sample
If the selected data source supports log samples and both log and metric queries, you will automatically see log line samples that contribute to the visualized metrics for metric queries. This feature is currently only supported by the Loki data source.
Switch from metrics to logs
If you are transitioning from a metrics data source that implements DataSourceWithQueryExportSupport (such as Prometheus) to a logging data source that supports DataSourceWithQueryImportSupport (such as Loki), Explore retains the labels from your query that exist in the logs and use them to query the log streams.
For example, after switching to the Loki data source, the Prometheus query grafana_alerting_active_alerts{job="grafana"} changes to {job="grafana"}. This will retrieve a set of logs within the specified time range, which can be searched using grep or text search.


