Important: This documentation is about an older version. It's relevant only to the release noted, many of the features and functions have been updated or replaced. Please view the current version.
Text
Text visualizations let you include text or HTML in your dashboards. This can be used to add contextual information and descriptions or embed complex HTML.
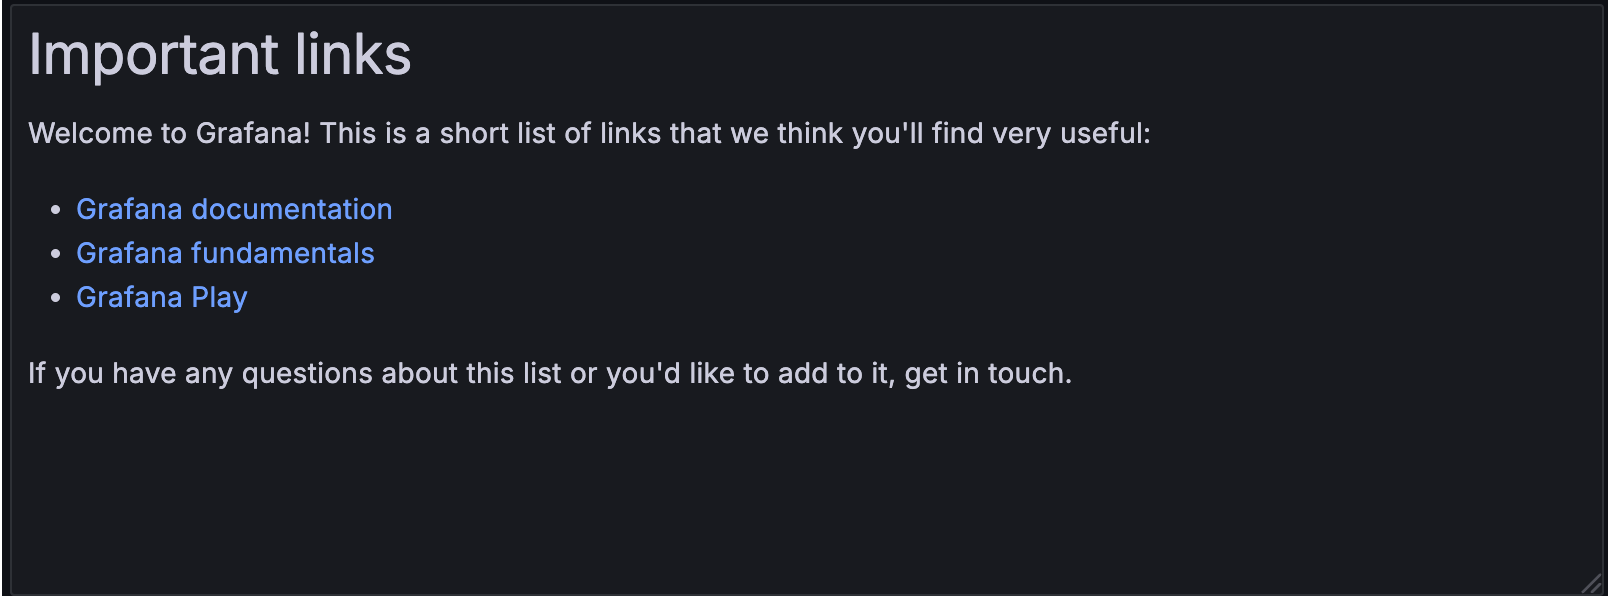
For example, if you want to display important links on your dashboard, you can use a text visualization to add these links:
With Grafana Play, you can explore and see how it works, learning from practical examples to accelerate your development. This feature can be seen on Text Panel.
Use a text visualization when you need to:
- Add important links or useful annotations.
- Provide instructions or guidance on how to interpret different panels, configure settings, or take specific actions based on the displayed data.
- Announce any scheduled maintenance or downtime that might impact your dashboards.
Configuration options
The following section describes the configuration options available in the panel editor pane for this visualization. These options are, as much as possible, ordered as they appear in Grafana.
Panel options
In the Panel options section of the panel editor pane, set basic options like panel title and description, as well as panel links. To learn more, refer to Configure panel options.
Text options
Use the following options to refine your text visualization.


