Important: This documentation is about an older version. It's relevant only to the release noted, many of the features and functions have been updated or replaced. Please view the current version.
Configure panel options
A Grafana panel is a visual representation of data that you can customize by defining a data source query, transforming and formatting data, and configuring visualization settings.
A panel editor includes a query builder and a series of options that you can use to transform data and add information to your panels.
This topic describes how to:
- Open a panel for editing
- Add a panel title and description
- View a panel JSON model
- Configure repeating rows and panels
Edit a panel
After you add a panel to a dashboard, you can open it at any time to change or update queries, add data transformation, and change visualization settings.
Open the dashboard that contains the panel you want to edit.
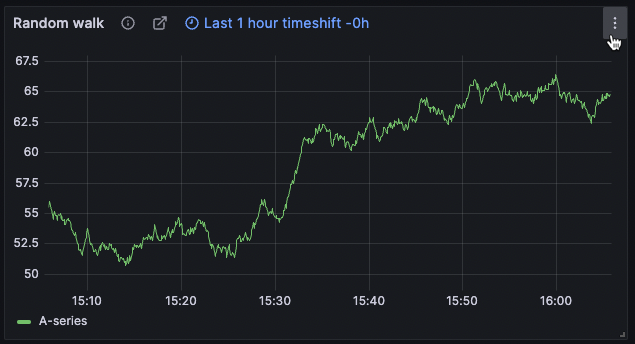
Hover over any part of the panel to display the actions menu on the top right corner.
Click the menu and select Edit.
![Panel with menu displayed]()
To use a keyboard shortcut to open the panel, hover over the panel and press
e.The panel opens in edit mode.
Add a title and description to a panel
You can use generative AI to create panel titles and descriptions with the Grafana LLM plugin, which is currently in public preview. To enable this, refer to the Set up generative AI features for dashboards documentation. Alternatively, you can take the following steps to create them yourself.
Add a title and description to a panel to share with users any important information about the visualization. For example, use the description to document the purpose of the visualization.
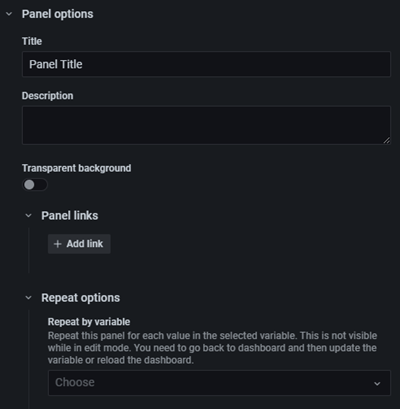
In the panel display options pane, locate the Panel options section.
Enter a Title.
Text entered in this field appears at the top of your panel in the panel editor and in the dashboard.
Write a description of the panel and the data you are displaying.
Text entered in this field appears in a tooltip in the upper-left corner of the panel.
You can use variables you have defined in the Title and Description field, but not global variables.
![Panel editor pane with Panel options section expanded]()
View a panel JSON model
Explore and export panel, panel data, and data frame JSON models.
Open the dashboard that contains the panel.
Hover over any part of the panel to display the actions menu on the top right corner.
Click the menu and select Inspect > Panel JSON.
In the Select source field, select one of the following options:
- Panel JSON: Displays a JSON object representing the panel.
- Panel data: Displays a JSON object representing the data that was passed to the panel.
- DataFrame structure: Displays the data structure of the panel, including any transformations, field configurations, and override configurations that have been applied.
To explore the JSON, click
>to expand or collapse portions of the JSON model.
Configure repeating panels
You can configure Grafana to dynamically add panels or rows to a dashboard. A dynamic panel is a panel that the system creates based on the value of a variable. Variables dynamically change your queries across all panels in a dashboard. For more information about repeating rows, refer to Configure repeating rows.
Note
Repeating panels require variables to have one or more items selected; you can’t repeat a panel zero times to hide it.
To see an example of repeating panels, refer to this dashboard with repeating panels.
Before you begin:
- Ensure that the query includes a multi-value variable.
To configure repeating panels:
Edit the panel you want to repeat.
On the display options pane, click Panel options > Repeat options.
Select a
direction.- Choose
horizontalto arrange panels side-by-side. Grafana adjusts the width of a repeated panel. Currently, you can’t mix other panels on a row with a repeated panel. - Choose
verticalto arrange panels in a column. The width of repeated panels is the same as the original, repeated panel.
- Choose
To propagate changes to all panels, reload the dashboard.


