Important: This documentation is about an older version. It's relevant only to the release noted, many of the features and functions have been updated or replaced. Please view the current version.
Explore
Grafana’s dashboard UI is all about building dashboards for visualization. Explore strips away the dashboard and panel options so that you can focus on the query. It helps you iterate until you have a working query and then think about building a dashboard.
Refer to Role-based access control in Grafana Enterprise to understand how you can control access with role-based permissions.
If you just want to explore your data and do not want to create a dashboard, then Explore makes this much easier. If your data source supports graph and table data, then Explore shows the results both as a graph and a table. This allows you to see trends in the data and more details at the same time. See also:
- Query management in Explore
- Logs integration in Explore
- Trace integration in Explore
- Inspector in Explore
Start exploring
Refer to Role-based access Control in Grafana Enterprise to understand how you can manage Explore with role-based permissions.
In order to access Explore, you must have an editor or an administrator role, unless the viewers_can_edit option is enabled. Refer to About users and permissions for more information on what each role has access to.
To access Explore:
Click on the Explore icon on the menu bar.
An empty Explore tab opens.
Alternately to start with an existing query in a panel, choose the Explore option from the Panel menu. This opens an Explore tab with the query from the panel and allows you to tweak or iterate in the query outside of your dashboard.
![Screenshot of the panel menu including the Explore option Screenshot of the panel menu including the Explore option]()
Screenshot of the panel menu including the Explore option Choose your data source from the drop-down in the top left.
You can also click Open advanced data source picker to see more options, including adding a data source (Admins only).
Write the query using a query editor provided by the selected data source. Please check data sources documentation to see how to use various query editors.
For general documentation on querying data sources in Grafana, see Query and transform data.
Run the query using the button in the top right corner.
Split and compare
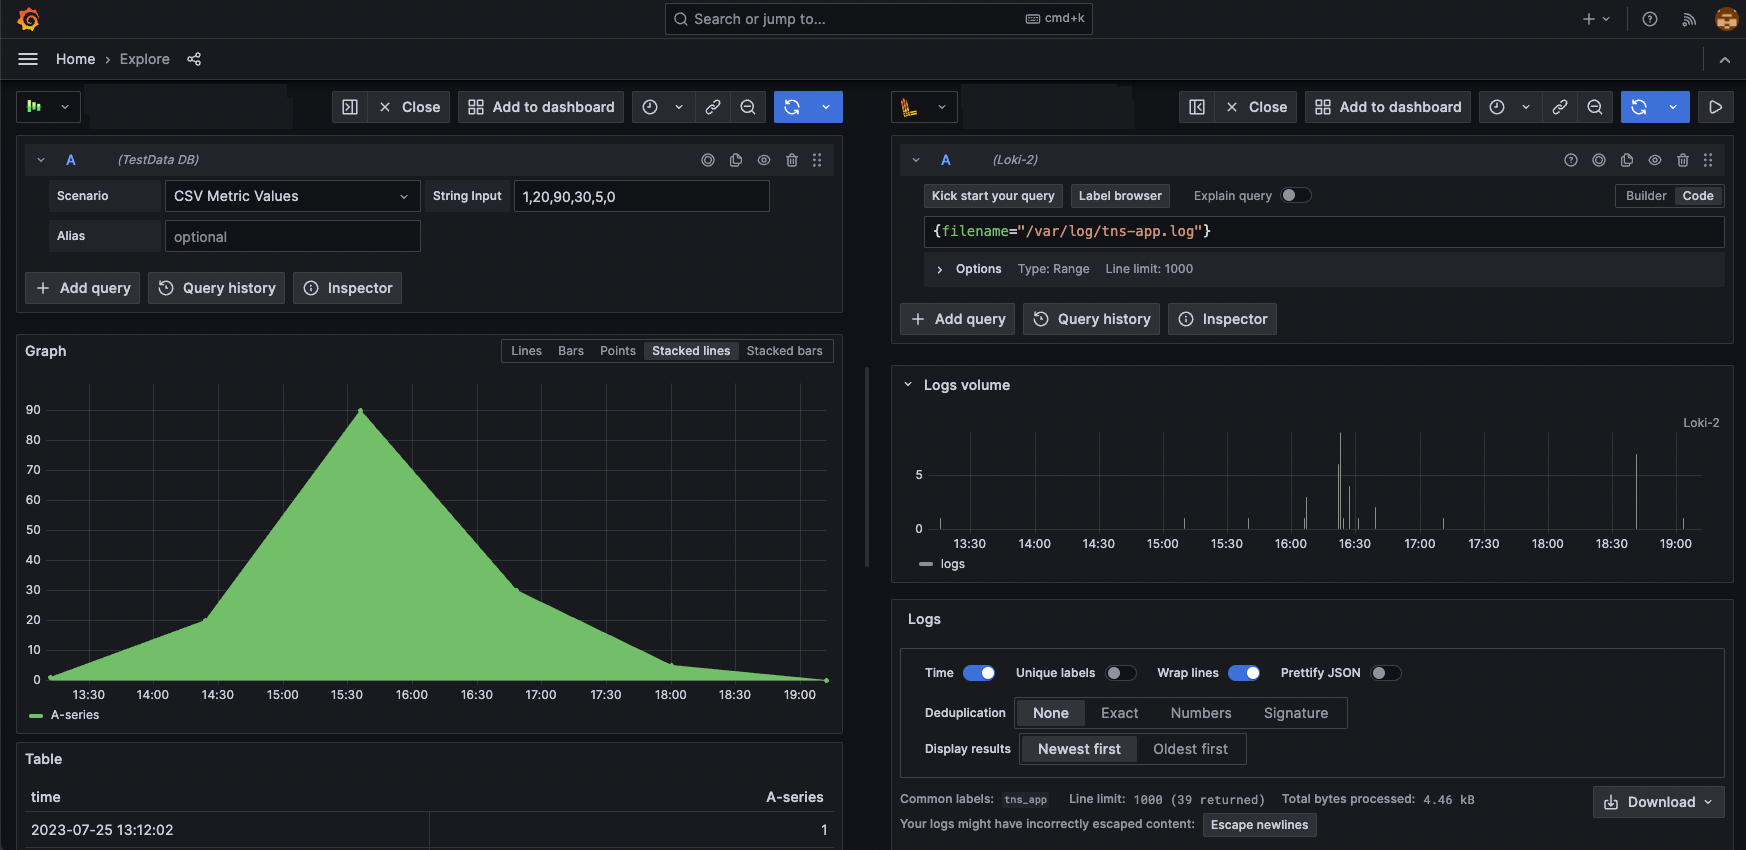
The split view provides an easy way to compare visualizations side-by-side or to look at related data together on one page.
To open the split view:
- Click the split button to duplicate the current query and split the page into two side-by-side queries.
It is possible to select another data source for the new query which for example, allows you to compare the same query for two different servers or to compare the staging environment to the production environment.

In split view, timepickers for both panels can be linked (if you change one, the other gets changed as well) by clicking on one of the time-sync buttons attached to the timepickers. Linking of timepickers helps with keeping the start and the end times of the split view queries in sync. It ensures that you’re looking at the same time interval in both split panels.
To close the newly created query, click on the Close Split button.
Share Explore URLs
When using Explore, the URL in the browser address bar updates as you make changes to the queries. You can share or bookmark this URL.
Generating Explore URLs from external tools
Because Explore URLs have a defined structure, you can build a URL from external tools and open it in Grafana. The URL structure is:
http://<grafana_url>/explore?panes=<panes>&schemaVersion=<schema_version>&orgId=<org_id>where:
org_idis the organization IDschema_versionis the schema version (should be set to the latest version which is1)panesis a url-encoded JSON object of panes, where each key is the pane ID and each value is an object matching the following schema:
{
  datasource: string; // the pane's root datasource UID, or `-- Mixed --` for mixed datasources
  queries: {
    refId: string; // an alphanumeric identifier for this query, must be unique within the pane, i.e. "A", "B", "C", etc.
    datasource: {
      uid: string; // the query's datasource UID ie: "AD7864H6422"
      type: string; // the query's datasource type-id, i.e: "loki"
    }
    // ... any other datasource-specific query parameters
  }[]; // array of queries for this pane
  range: {
    from: string; // the start time, in milliseconds since epoch
    to: string; // the end time, in milliseconds since epoch
  }
}
Note
The
fromandtoalso accept relative ranges defined in Time units and relative ranges.
Share shortened link
Note
Available in Grafana 7.3 and later versions.
The Share shortened link capability allows you to create smaller and simpler URLs of the format /goto/:uid instead of using longer URLs with query parameters. To create a shortened link to the executed query, click the Share option in the Explore toolbar. A shortened link that is never used will automatically get deleted after seven (7) days.


