Important: This documentation is about an older version. It's relevant only to the release noted, many of the features and functions have been updated or replaced. Please view the current version.
Tempo data source
Grafana ships with built-in support for Tempo, a high-volume, minimal-dependency trace storage, open-source tracing solution from Grafana Labs. This topic explains configuration and queries specific to the Tempo data source.
For instructions on how to add a data source to Grafana, refer to the administration documentation. Only users with the organization administrator role can add data sources. Administrators can also configure the data source via YAML with Grafana’s provisioning system.
Once you’ve added the data source, you can configure it so that your Grafana instance’s users can create queries in its query editor when they build dashboards and use Explore.
You can also use the Service Graph to view service relationships, track RED metrics, upload a JSON trace file, link to a trace ID from logs, and link to a trace ID from metrics.
Configure the data source
To configure basic settings for the data source, complete the following steps:
Click Connections in the left-side menu.
Under Your connections, click Data sources.
Enter
Tempoin the search bar.Select Tempo.
The Settings tab of the data source is displayed.
Set the data source’s basic configuration options:
You can also configure settings specific to the Tempo data source. These options are described in the sections below.
Trace to logs
Note
Available in Grafana v7.4 and higher. If you use Grafana Cloud, open a support ticket in the Cloud Portal to access this feature.
The Trace to logs setting configures the trace to logs feature that is available when you integrate Grafana with Tempo.
There are two ways to configure the trace to logs feature:
- Use a simplified configuration with default query, or
- Configure a custom query where you can use a template language to interpolate variables from the trace or span.
Use a simple configuration
- Select the target data source.
- Set start and end time shift. As the logs timestamps may not exactly match the timestamps of the spans in trace it may be necessary to search in larger or shifted time range to find the desired logs.
- Select which tags to use in the logs query. The tags you configure must be present in the spans attributes or resources for a trace to logs span link to appear. You can optionally configure a new name for the tag. This is useful for example if the tag has dots in the name and the target data source does not allow using dots in labels. In that case you can for example remap
http.statustohttp_status. - Optionally switch on the Filter by trace ID and/or Filter by span ID setting to further filter the logs if your logs consistently contain trace or span IDs.
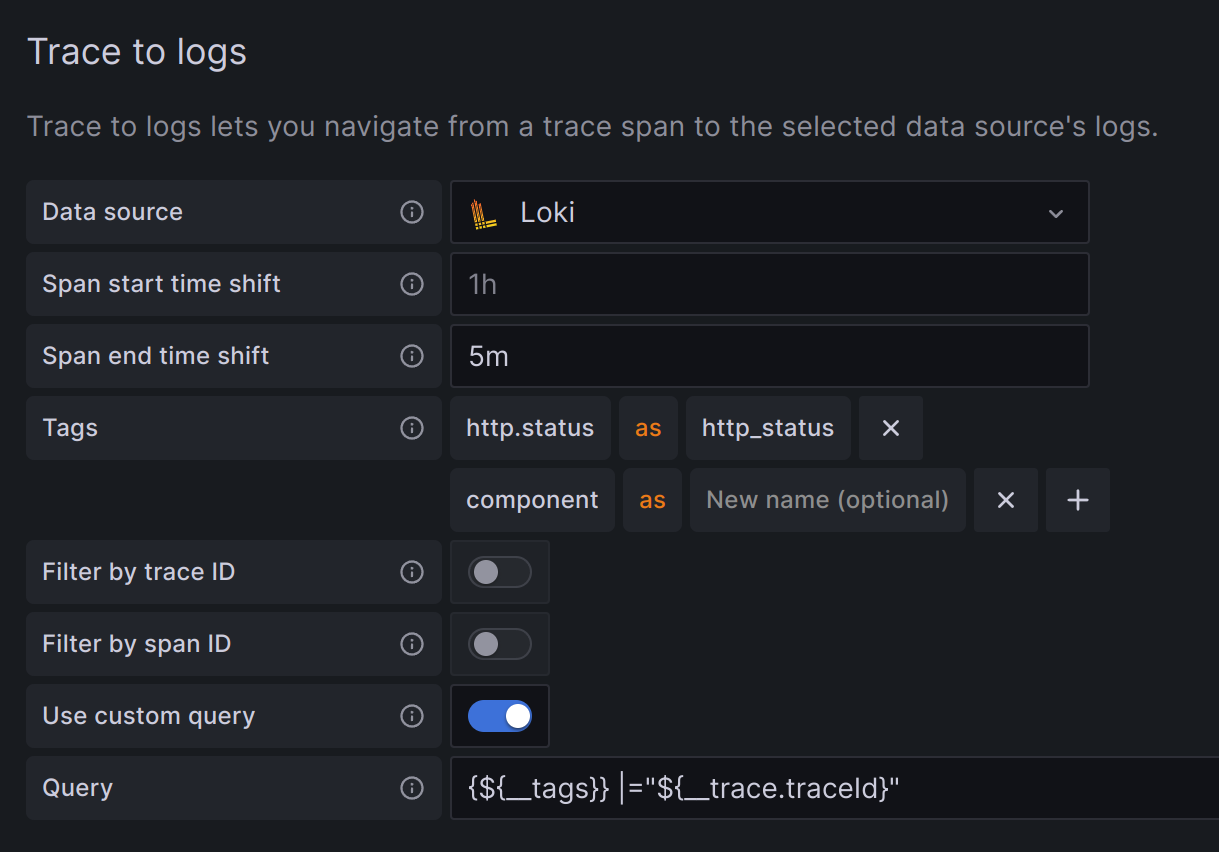
Configure a custom query
- Select the target data source.
- Set start and end time shift. As the logs timestamps may not exactly match the timestamps of the spans in the trace it may be necessary to widen or shift the time range to find the desired logs.
- Optionally select tags to map. These tags can be used in the custom query with
${__tags}variable. This variable will interpolate the mapped tags as list in an appropriate syntax for the data source and will only include the tags that were present in the span omitting those that weren’t present. You can optionally configure a new name for the tag. This is useful in cases where the tag has dots in the name and the target data source does not allow using dots in labels. For example, you can remaphttp.statustohttp_statusin such a case. If you don’t map any tags here, you can still use any tag in the query like thismethod="${__span.tags.method}". - Skip Filter by trace ID and Filter by span ID settings as these cannot be used with a custom query.
- Switch on Use custom query.
- Specify a custom query to be used to query the logs. You can use various variables to make that query relevant for current span. The link will only be shown only if all the variables are interpolated with non-empty values to prevent creating an invalid query.
Variables that can be used in a custom query
To use a variable you need to wrap it in ${}. For example ${__span.name}.
The following table describes the ways in which you can configure your trace to logs settings:
Trace to metrics
Note
This feature is behind the
traceToMetrics[feature toggle][configure-grafana-feature-toggles]. If you use Grafana Cloud, open a support ticket in the Cloud Portal to access this feature.
The Trace to metrics setting configures the trace to metrics feature available when integrating Grafana with Tempo.
To configure trace to metrics:
- Select the target data source.
- Create any desired linked queries.
Each linked query consists of:
- Link Label: (Optional) Descriptive label for the linked query.
- Query: The query ran when navigating from a trace to the metrics data source.
Interpolate tags using the
$__tagskeyword. For example, when you configure the queryrequests_total{$__tags}with the tagsk8s.pod=podandcluster, the result looks likerequests_total{pod="nginx-554b9", cluster="us-east-1"}.
Service Graph
The Service Graph setting configures the Service Graph feature.
Configure the Data source setting to define in which Prometheus instance the Service Graph data is stored.
To use the Service Graph, refer to the Service Graph documentation.
Node Graph
The Node Graph setting enables the node graph visualization, which is disabled by default.
Once enabled, Grafana displays the node graph above the trace view.
Tempo search
The Search setting configures Tempo search.
You can configure the Hide search setting to hide the search query option in Explore if search is not configured in the Tempo instance.
Loki search
The Loki search setting configures the Loki search query type.
Configure the Data source setting to define which Loki instance you want to use to search traces. You must configure derived fields in the Loki instance.
TraceID query
The TraceID query setting modifies how TraceID queries are run. The time range can be used when there are performance issues or timeouts since it will narrow down the search to the defined range. This setting is disabled by default.
You can configure this setting as follows:
Span bar
The Span bar setting helps you display additional information in the span bar row.
You can choose one of three options:
Provision the data source
You can define and configure the Tempo data source in YAML files as part of Grafana’s provisioning system. For more information about provisioning and available configuration options, refer to Provisioning Grafana.
Provisioning example
apiVersion: 1

datasources:
  - name: Tempo
    type: tempo
    uid: EbPG8fYoz
    url: http://localhost:3200
    access: proxy
    basicAuth: false
    jsonData:
      tracesToLogsV2:
        # Field with an internal link pointing to a logs data source in Grafana.
        # datasourceUid value must match the uid value of the logs data source.
        datasourceUid: 'loki'
        spanStartTimeShift: '1h'
        spanEndTimeShift: '-1h'
        tags: ['job', 'instance', 'pod', 'namespace']
        filterByTraceID: false
        filterBySpanID: false
        customQuery: true
        query: 'method="${__span.tags.method}"'
      tracesToMetrics:
        datasourceUid: 'prom'
        spanStartTimeShift: '1h'
        spanEndTimeShift: '-1h'
        tags: [{ key: 'service.name', value: 'service' }, { key: 'job' }]
        queries:
          - name: 'Sample query'
            query: 'sum(rate(traces_spanmetrics_latency_bucket{$__tags}[5m]))'
      serviceMap:
        datasourceUid: 'prometheus'
      nodeGraph:
        enabled: true
      search:
        hide: false
      lokiSearch:
        datasourceUid: 'loki'
      traceQuery:
        timeShiftEnabled: true
        spanStartTimeShift: '1h'
        spanEndTimeShift: '-1h'
      spanBar:
        type: 'Tag'
        tag: 'http.path'
Query the data source
The Tempo data source’s query editor helps you query and display traces from Tempo in Explore.
For details, refer to the query editor documentation.
Upload a JSON trace file
You can upload a JSON file that contains a single trace and visualize it. If the file has multiple traces, Grafana visualizes its first trace.
To download a trace or Service Graph through the inspector:
- Open the inspector.
- Navigate to the Data tab.
- Click Download traces or Download Service Graph.
Trace JSON example
{
  "batches": [
    {
      "resource": {
        "attributes": [
          { "key": "service.name", "value": { "stringValue": "db" } },
          { "key": "job", "value": { "stringValue": "tns/db" } },
          { "key": "opencensus.exporterversion", "value": { "stringValue": "Jaeger-Go-2.22.1" } },
          { "key": "host.name", "value": { "stringValue": "63d16772b4a2" } },
          { "key": "ip", "value": { "stringValue": "0.0.0.0" } },
          { "key": "client-uuid", "value": { "stringValue": "39fb01637a579639" } }
        ]
      },
      "instrumentationLibrarySpans": [
        {
          "instrumentationLibrary": {},
          "spans": [
            {
              "traceId": "AAAAAAAAAABguiq7RPE+rg==",
              "spanId": "cmteMBAvwNA=",
              "parentSpanId": "OY8PIaPbma4=",
              "name": "HTTP GET - root",
              "kind": "SPAN_KIND_SERVER",
              "startTimeUnixNano": "1627471657255809000",
              "endTimeUnixNano": "1627471657256268000",
              "attributes": [
                { "key": "http.status_code", "value": { "intValue": "200" } },
                { "key": "http.method", "value": { "stringValue": "GET" } },
                { "key": "http.url", "value": { "stringValue": "/" } },
                { "key": "component", "value": { "stringValue": "net/http" } }
              ],
              "status": {}
            }
          ]
        }
      ]
    }
  ]
}
Use the Service Graph
The Service Graph is a visual representation of the relationships between services. Each node on the graph represents a service such as an API or database.
You use the Service Graph to detect performance issues; track increases in error, fault, or throttle rates in services; and investigate root causes by viewing corresponding traces.

To display the Service Graph:
- Configure Grafana Agent or Tempo or GET to generate Service Graph data.
- Link a Prometheus data source in the Tempo data source’s Service Graph settings.
- Navigate to Explore.
- Select the Tempo data source.
- Select the Service Graph query type.
- Run the query.
- (Optional) Filter by service name.
For details, refer to Node Graph panel.
Each circle in the graph represents a service. To open a context menu with additional links for quick navigation to other relevant information, click a service.
Numbers inside the circles indicate the average time per request and requests per second.
Each circle’s color represents the percentage of requests in each state:
Open the Service Graph view
Service graph view displays a table of request rate, error rate, and duration metrics (RED) calculated from your incoming spans. It also includes a node graph view built from your spans.

For details, refer to the Service Graph view documentation.
To open the Service Graph view:
- Link a Prometheus data source in the Tempo data source settings.
- Navigate to Explore.
- Select the Tempo data source.
- Select the Service Graph query type.
- Run the query.
- (Optional) Filter your results.
Note
Grafana uses the
traces_spanmetrics_calls_totalmetric to display the name, rate, and error rate columns, andtraces_spanmetrics_latency_bucketto display the duration column. These metrics must exist in your Prometheus data source.
To open a query in Prometheus with the span name of that row automatically set in the query, click a row in the rate, error rate, or duration columns.
To open a query in Tempo with the span name of that row automatically set in the query, click a row in the links column.
Span Filters
Note
This feature is behind the
newTraceViewHeaderfeature toggle. If you use Grafana Cloud, open a support ticket in the Cloud Portal to access this feature.
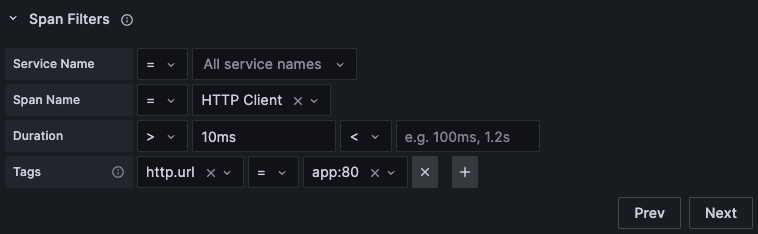
Using span filters, you can filter your spans in the trace timeline viewer. The more filters you add, the more specific are the filtered spans.
You can add one or more of the following filters:
- Service name
- Span name
- Duration
- Tags (which include tags, process tags, and log fields)
Link to a trace ID from logs
You can link to Tempo traces from logs in Loki, Elasticsearch, Splunk, and other logs data sources by configuring an internal link.
To configure this feature, see the Derived fields section of the Loki data source docs or the Data links section of the Elasticsearch or Splunk data source docs.
Link to a trace ID from metrics
You can link to Tempo traces from metrics in Prometheus data sources by configuring an exemplar.
To configure this feature, see the introduction to exemplars documentation.


