This release doubles down on dashboard automation and Git-powered workflows while delivering a range of polish and usability improvements.
The headline is improved dashboard productivity: Dynamic dashboards and template-driven workflows make it far easier to create, reuse, and operate dashboards at scale. Create dashboards from templates, map one variable to multiple values, apply regular expression transforms to variable values or display text, and benefit from smarter visualization suggestions and an updated gauge panel that help surface the right view for your data. At the same time, Git Sync is now available in public preview, providing a smooth Git-backed workflow to keep dashboards in source control and enable safer, auditable changes to dashboard content. These two areas together are aimed at speeding up development, improving consistency, and making dashboard CI/CD practical for teams.
Beyond dashboards, this version includes improvements across the product: Logs and Logs Drilldown get better default columns and save/resume log explorations, data sources receive sensible new defaults and expanded support, SCIM provisioning simplifies user and team management, short URLs are now persistent, and a small set of breaking changes and storage migration enhancements help ensure long-term manageability.
For even more detail about all the changes in this release, refer to the changelog. For the specific steps we recommend when you upgrade to v12.4, check out our
Upgrade Guide.
Grafana CloudAvailable in public previewOpen sourceEnterpriseExperimental
Dashboards and visualizations
Git Sync in Grafana lets you manage your dashboards as code as JSON files stored in GitHub. You and your team can use it to version control, collaborate, and automate deployments efficiently.
Grafana CloudAvailable in public previewOpen sourceEnterpriseAvailable in public preview
Last year, we launched Dynamic dashboards as an experimental feature. Today, we’re pleased to announce that it is now in public preview. This change includes new functionality and a revamped user experience.
Grafana CloudAvailable in public previewOpen sourceEnterpriseAvailable in public preview
Dashboards and visualizations
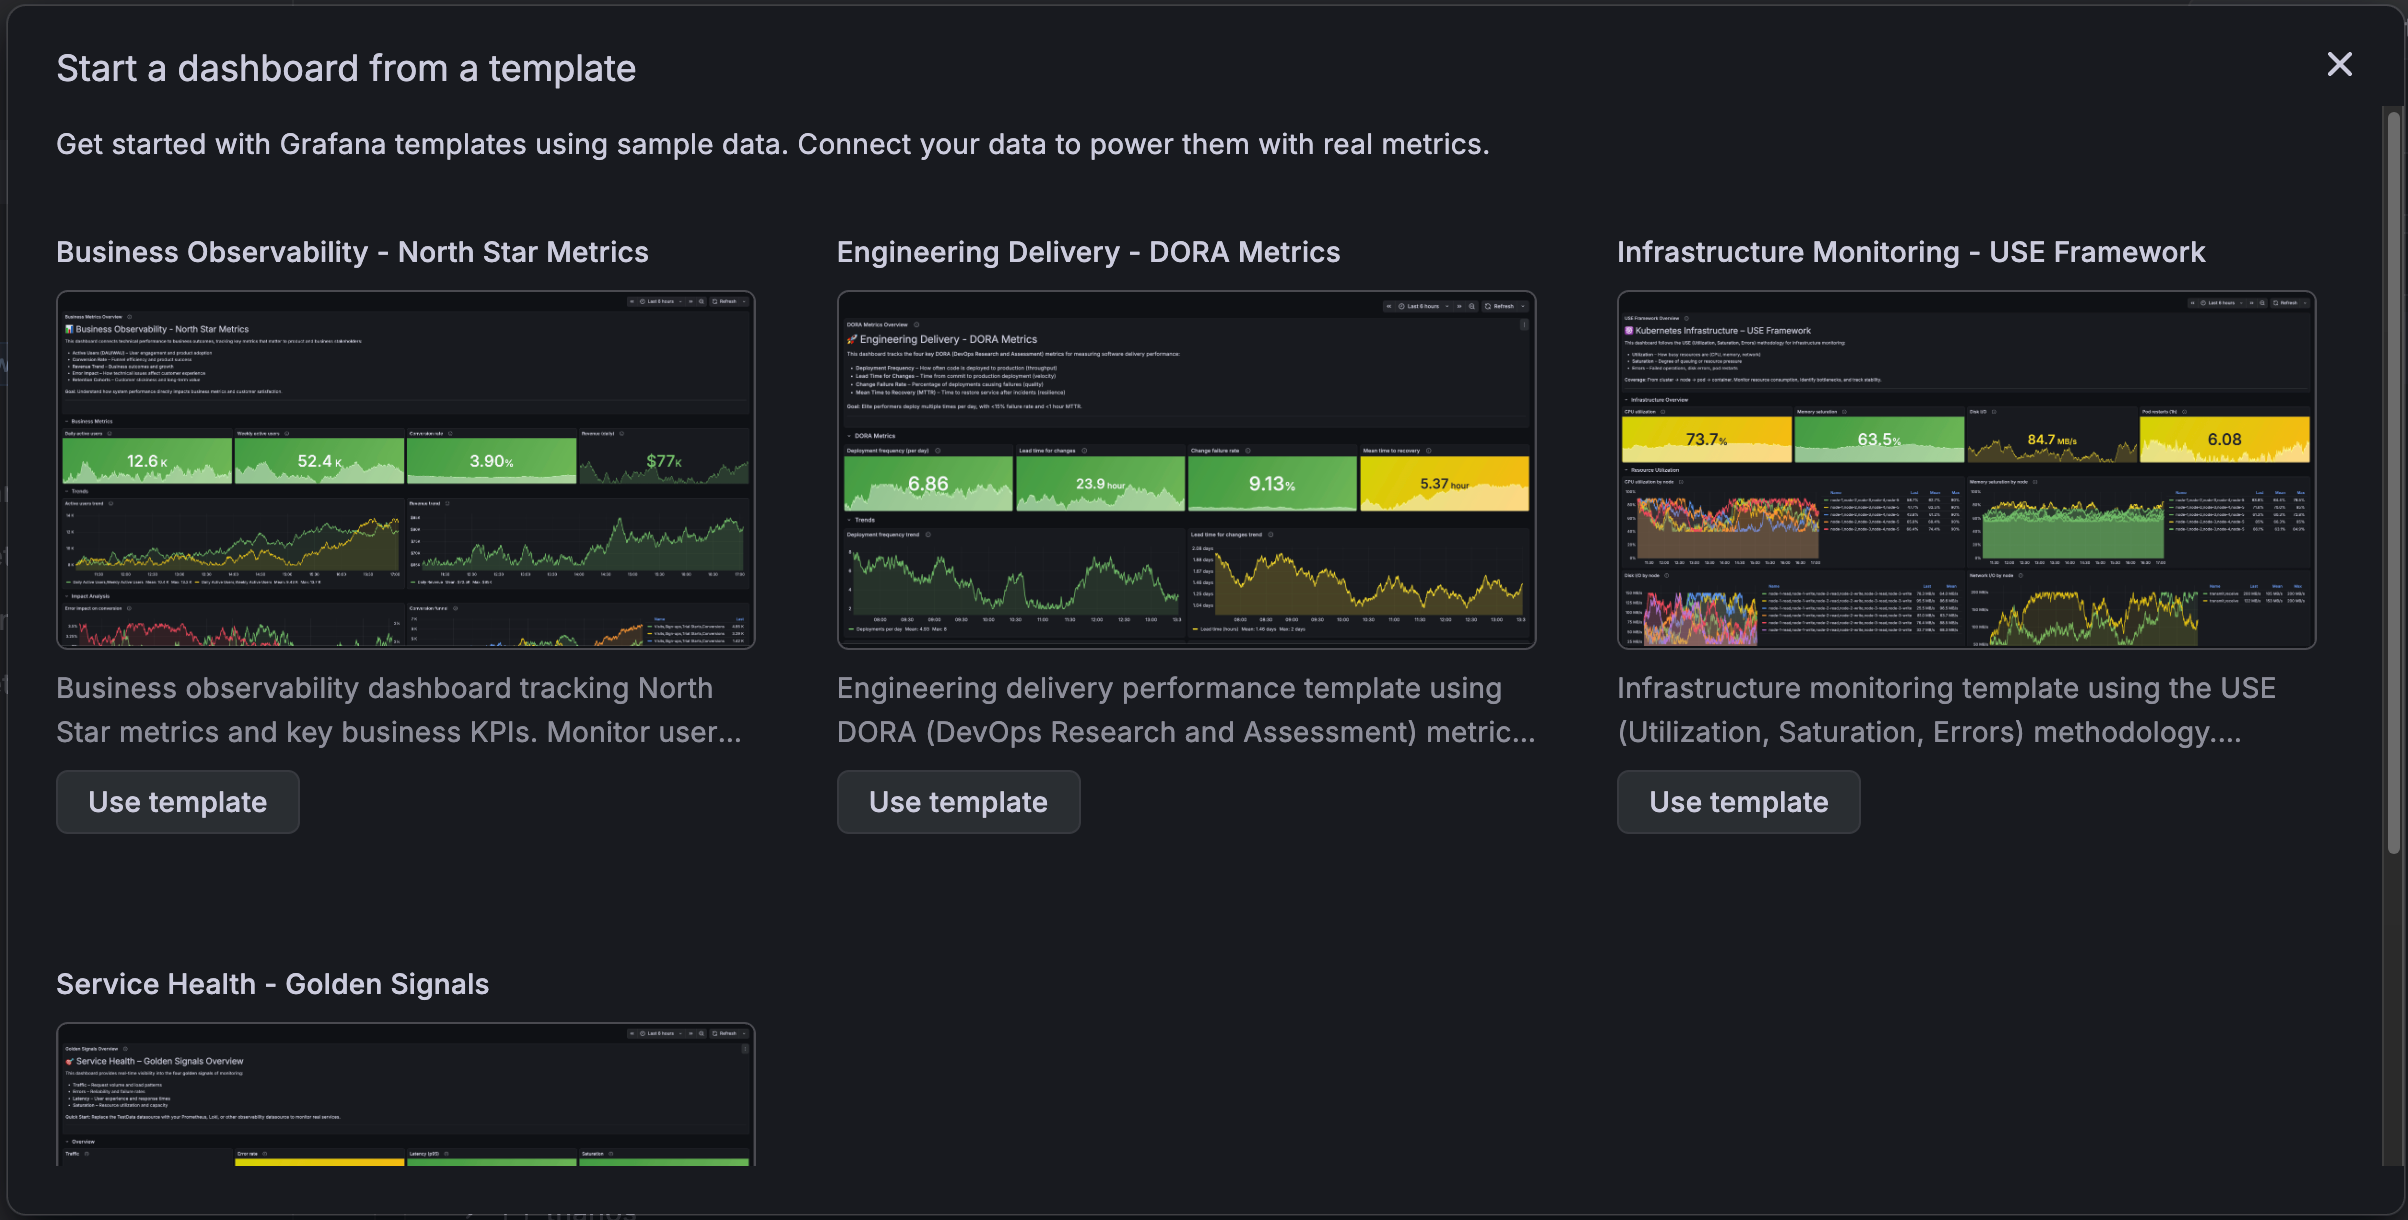
Create dashboards based on templates using sample data.
Then connect your own data to power them with real metrics.
The templates provide standardized dashboard layouts designed to help you answer engineering or business questions consistently.
For instance, the DORA template allows all teams within an organization to measure delivery performance using a widely adopted industry framework.
Grafana CloudAvailable in public previewOpen sourceEnterpriseAvailable in public preview
Dashboards and visualizations
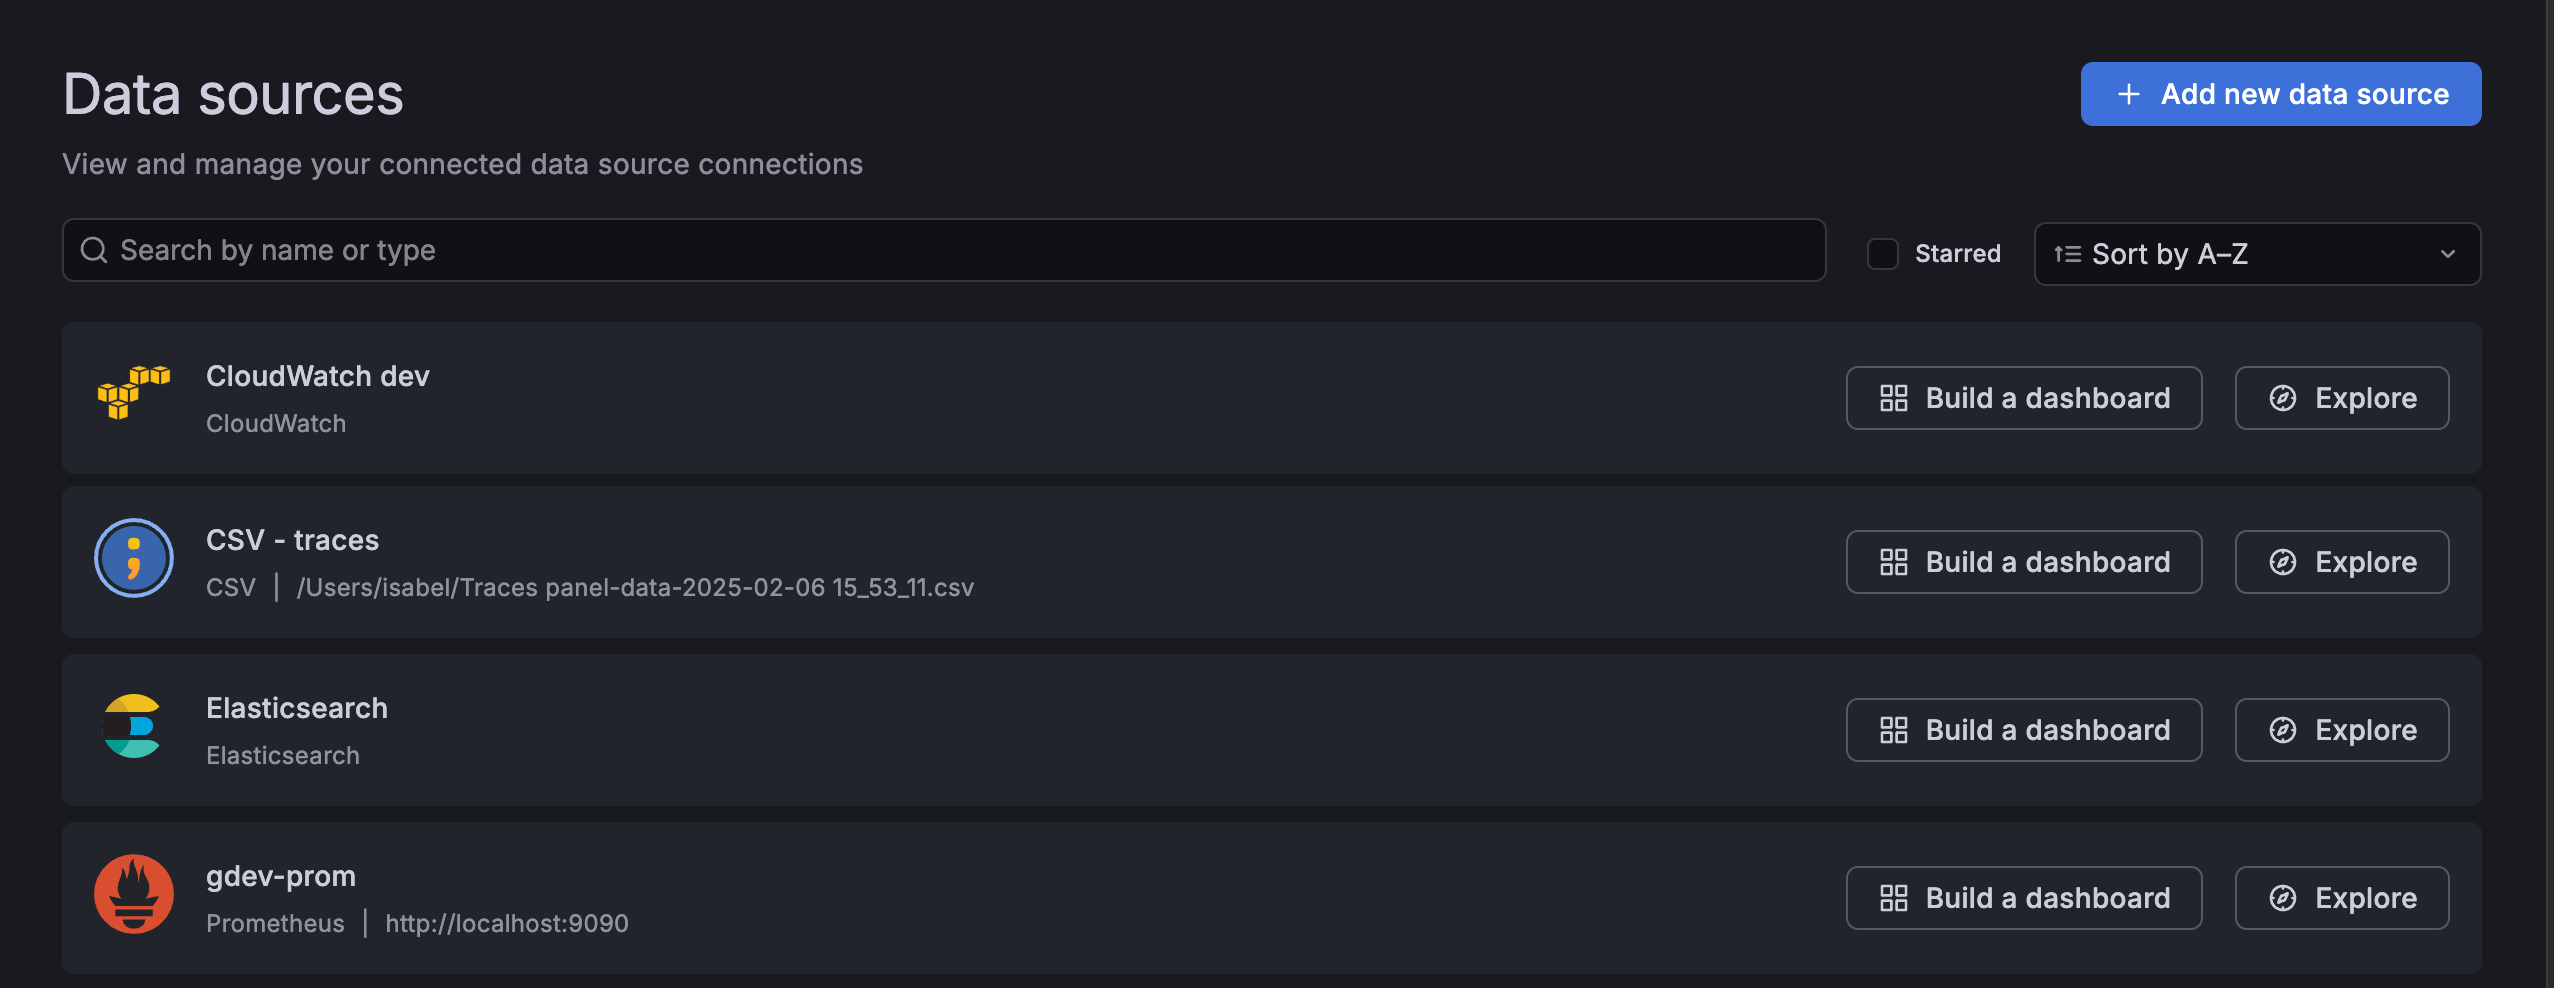
We’re introducing suggested dashboards, a feature designed to reduce the time it takes for you to create your first effective dashboard. Suggested dashboards address the challenge of an empty dashboard by leveraging the context of your data connections. The empty dashboard now includes suggestions for pre-built dashboards based on your connected data sources. With these dashboards, curated from both Grafana and the Community, you can achieve faster initial time-to-insight.
Grafana CloudGenerally AvailableOpen sourceEnterpriseAvailable in public preview
Dashboards and visualizations
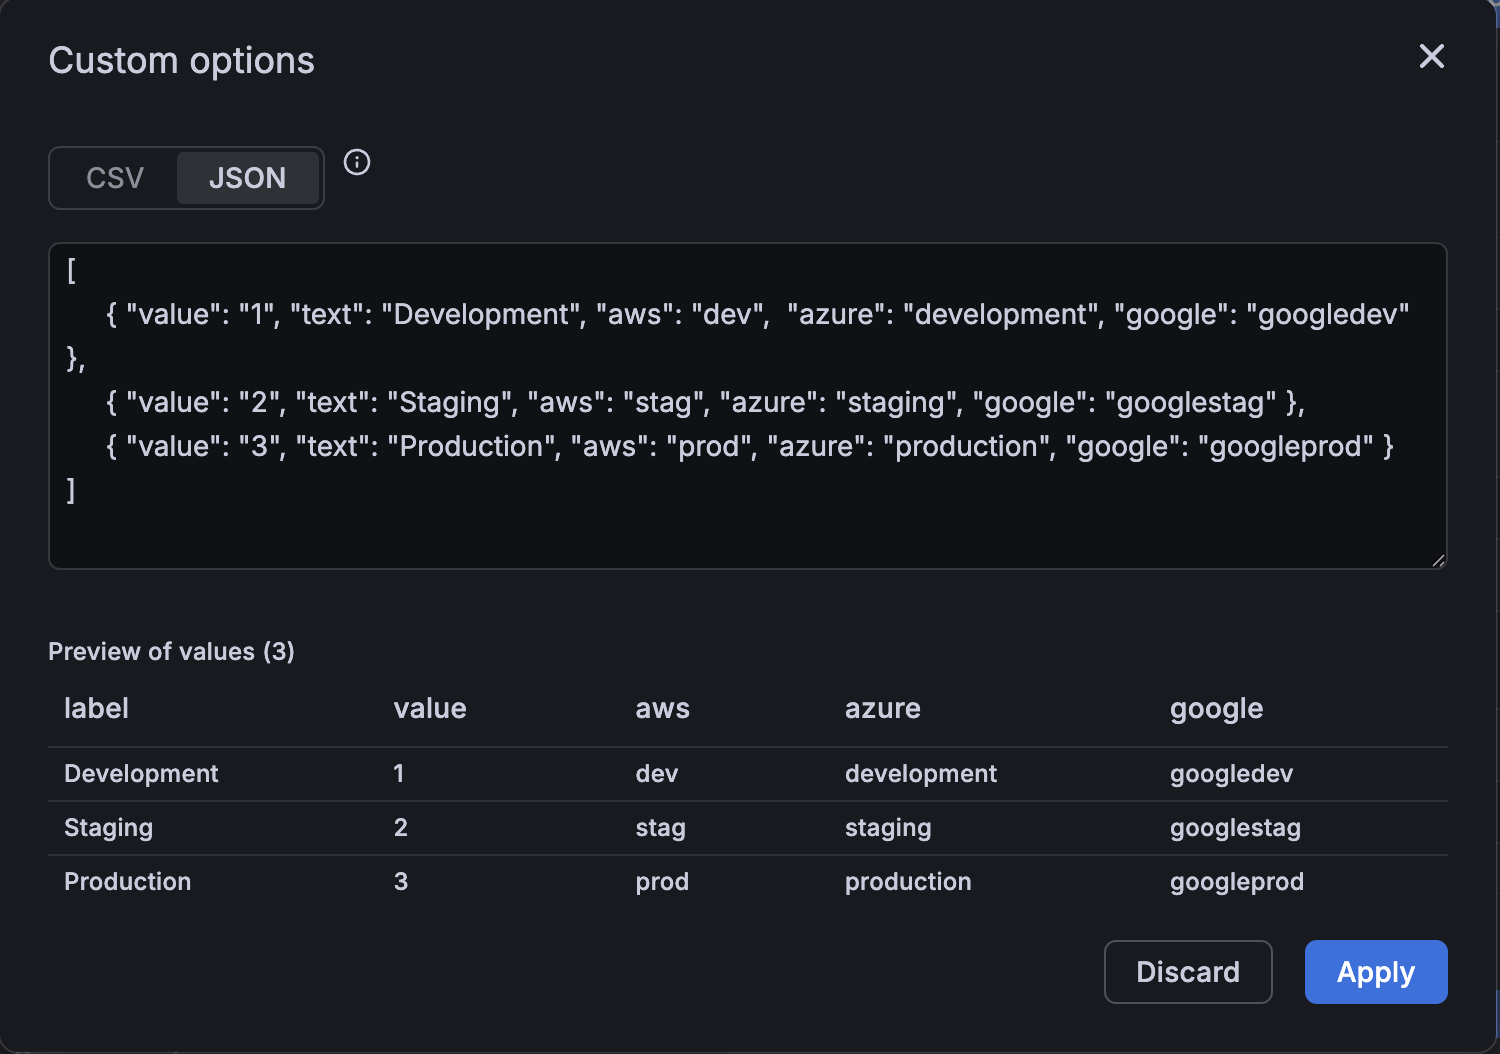
We’re excited to introduce multi-property variables—a simple, powerful way to let you map several identifiers to a single variable.
Instead of creating and keeping multiple variables for the same logical concept in sync (for example, an environment identified as “dev” vs “development”), you can map all of those identifiers to one variable and then reference any property you need in panels and queries.
This reduces dashboard clutter and makes multi-source dashboards much easier to author and maintain.
Grafana CloudGenerally AvailableOpen sourceEnterpriseGenerally Available
Dashboards and visualizations
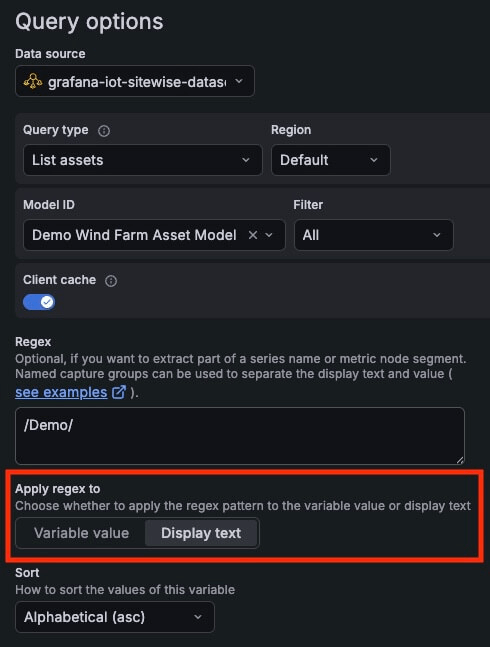
Find the right query variable values to show by applying a regex pattern to the display text instead of the variable value. This is a great shortcut for those times when the text you see in the UI doesn’t match the raw value you need to capture.
Grafana CloudAvailable in public previewEnterpriseAvailable in public preview
Dashboards and visualizations
Saved queries now supports role-based access control (RBAC), giving teams a clearer and safer way to share and manage queries.
Saved queries are now shared by default: all users with access can reuse them, while only users with the Writer role can create, edit, or delete them. This replaces the previous per-query sharing checkbox with consistent, role-based permissions.
Grafana CloudGenerally AvailableOpen sourceEnterpriseGenerally Available
Dashboards and visualizations
Dashboards can get crowded when you rely on many template variables, annotation controls, and dashboard links. These elements take up valuable space in the toolbar and can make it harder to stay focused on the data that matters. To improve clarity and reduce visual noise, we’re introducing a new dashboard controls menu that keeps your dashboards clean and organized.
Grafana CloudAvailable in public previewOpen sourceEnterpriseAvailable in public preview
Dashboards and visualizations
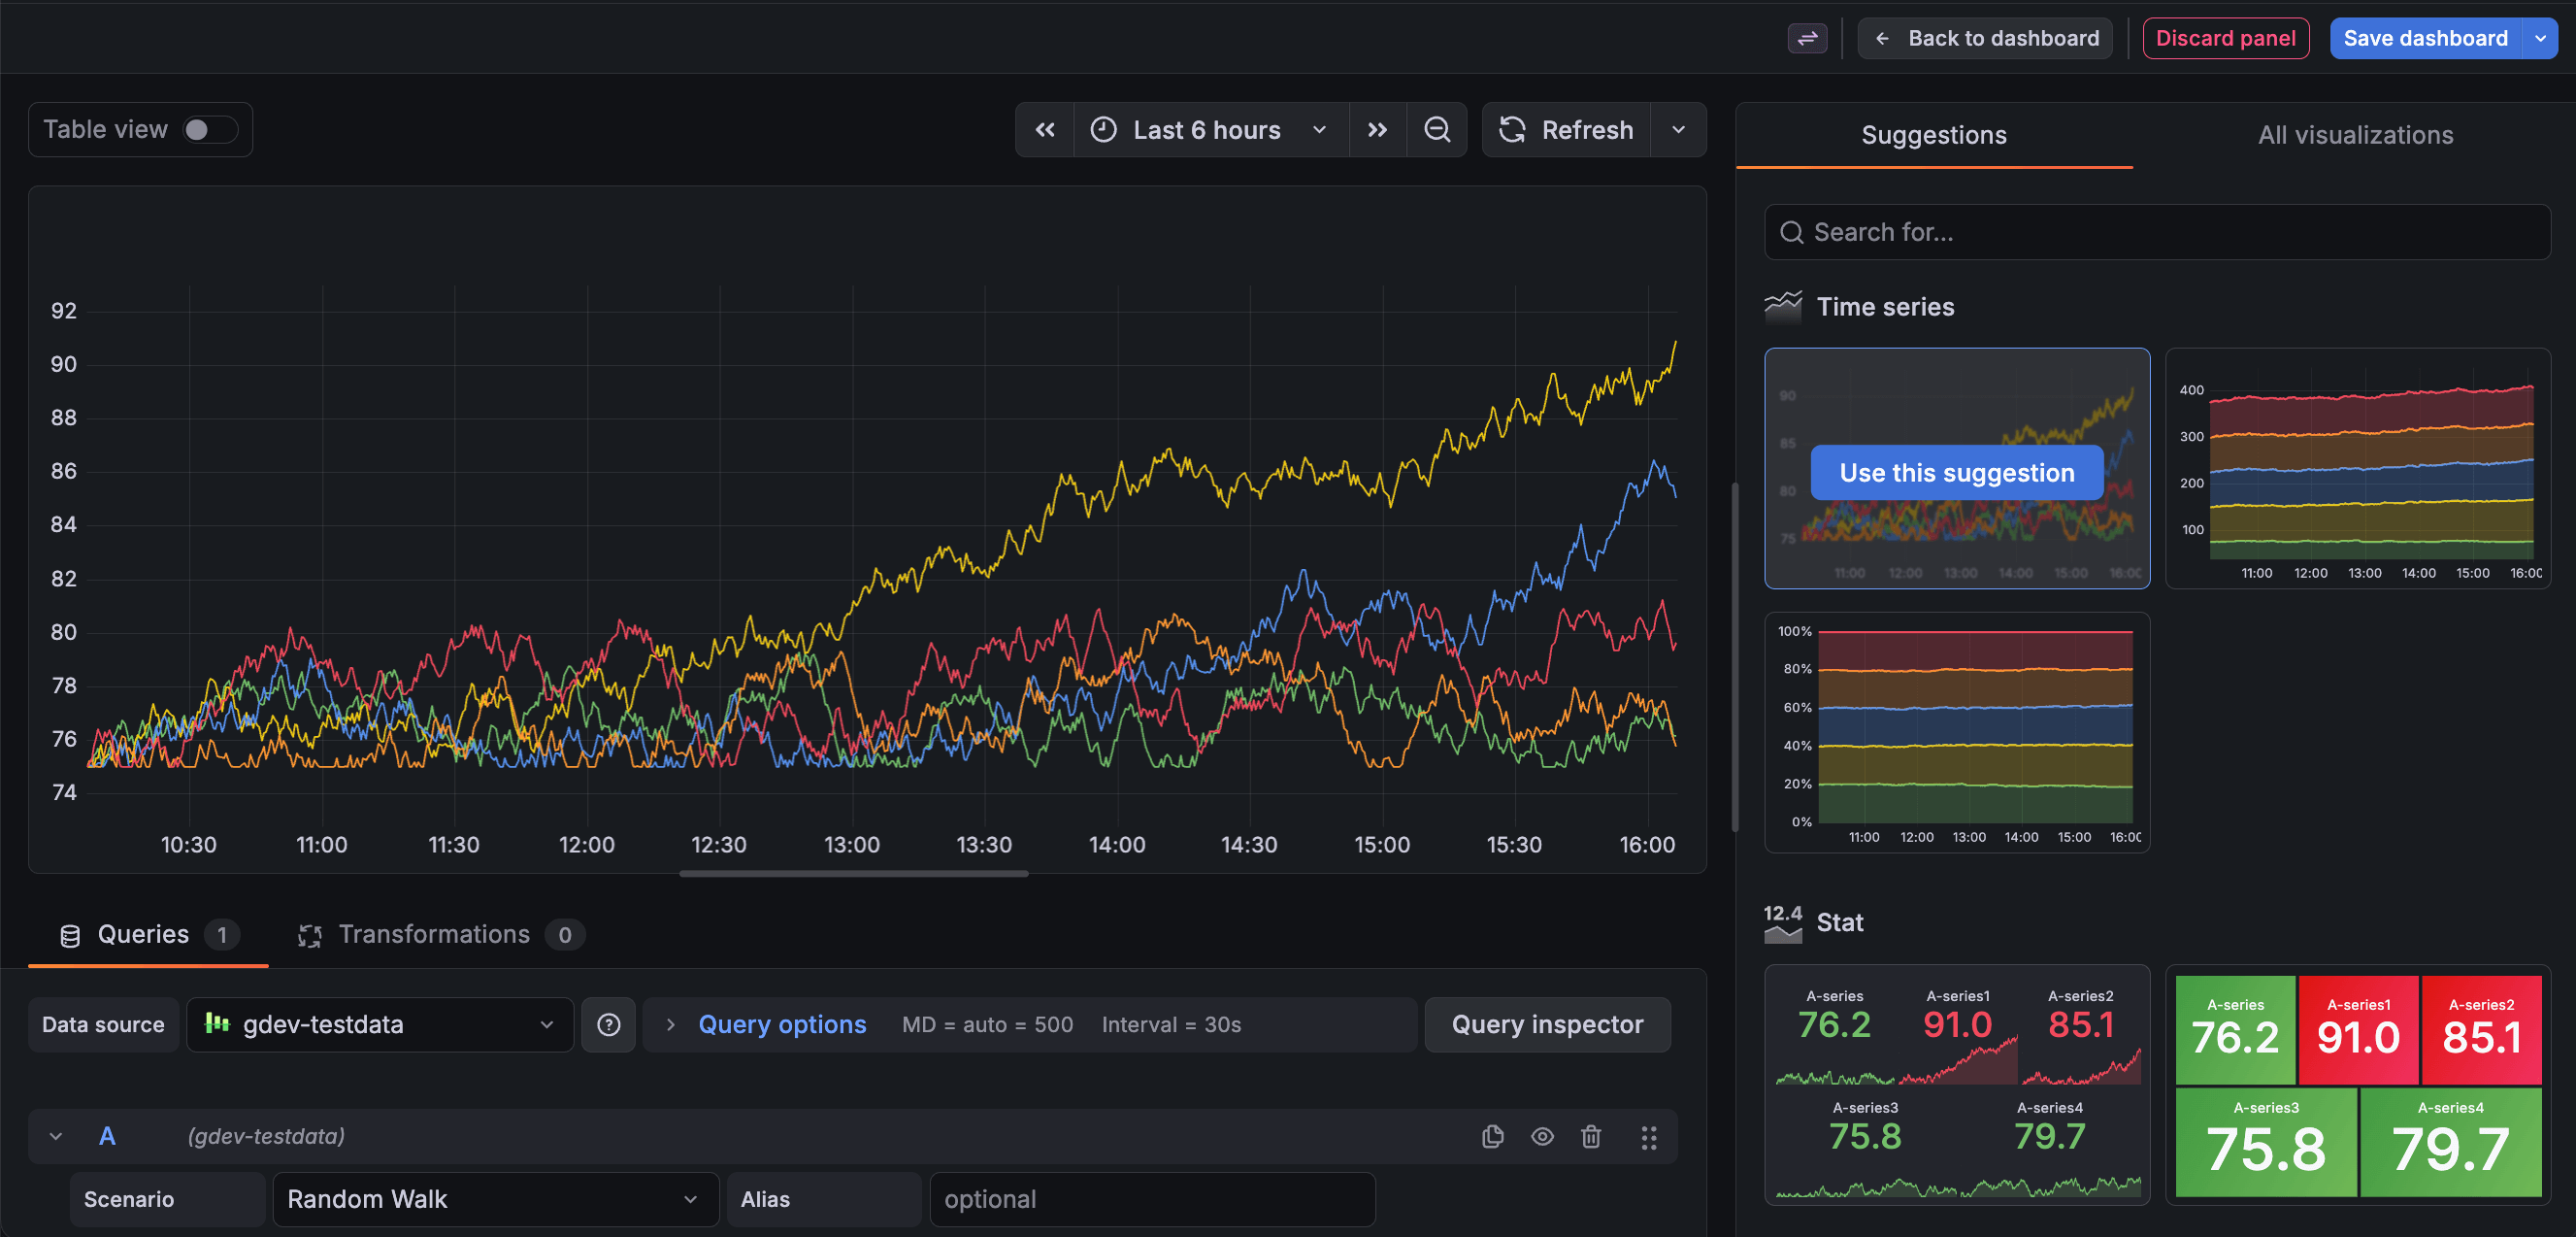
Visualization Suggestions, which were introduced in Grafana 8.3.0, have been updated to provide more applicable suggestions, and are now the default method to select a panel visualization.
Grafana CloudAvailable in public previewOpen sourceEnterpriseAvailable in public preview
Dashboards and visualizations
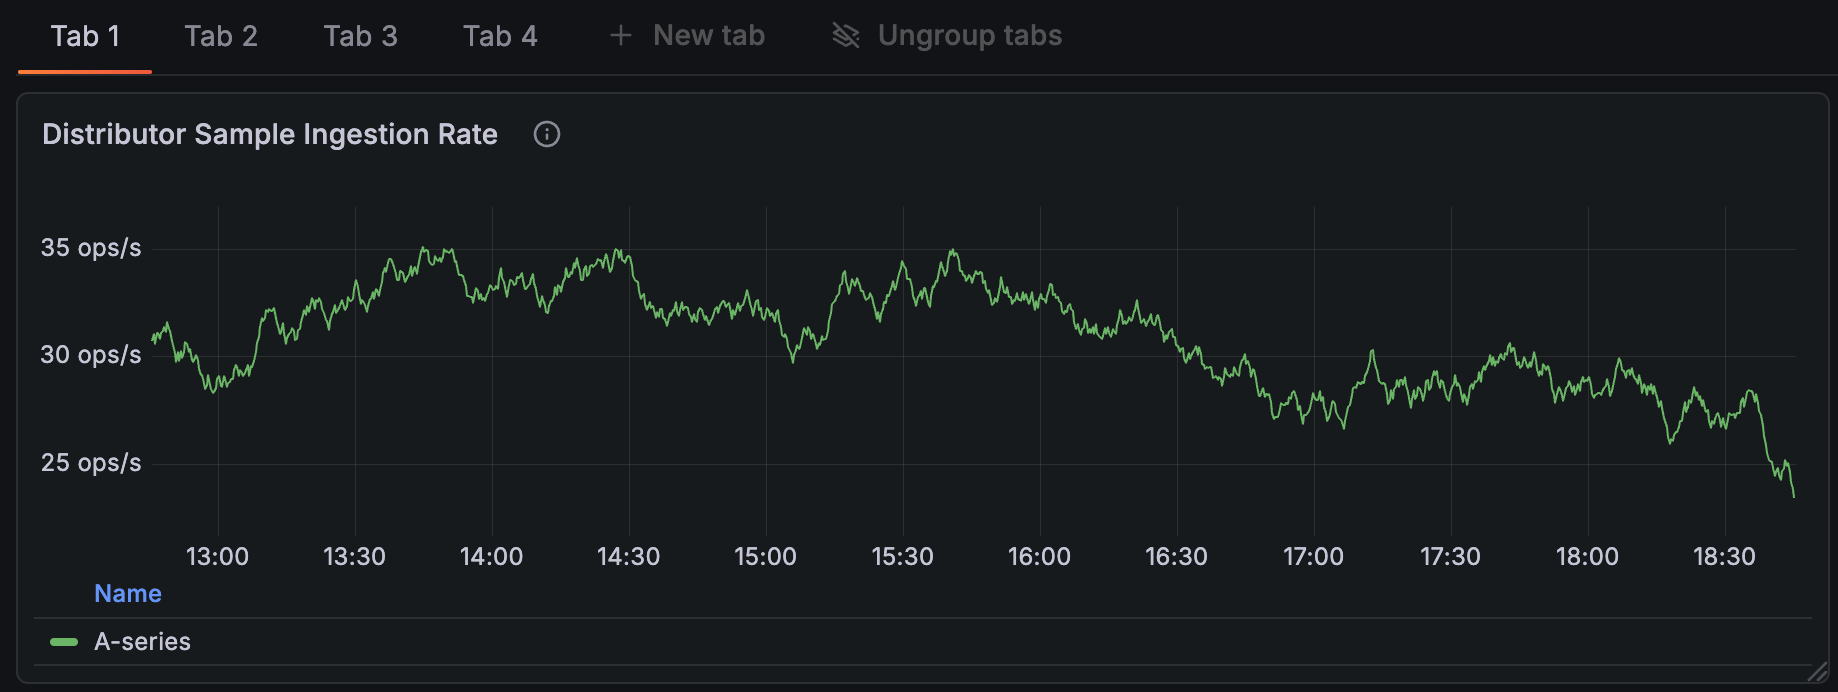
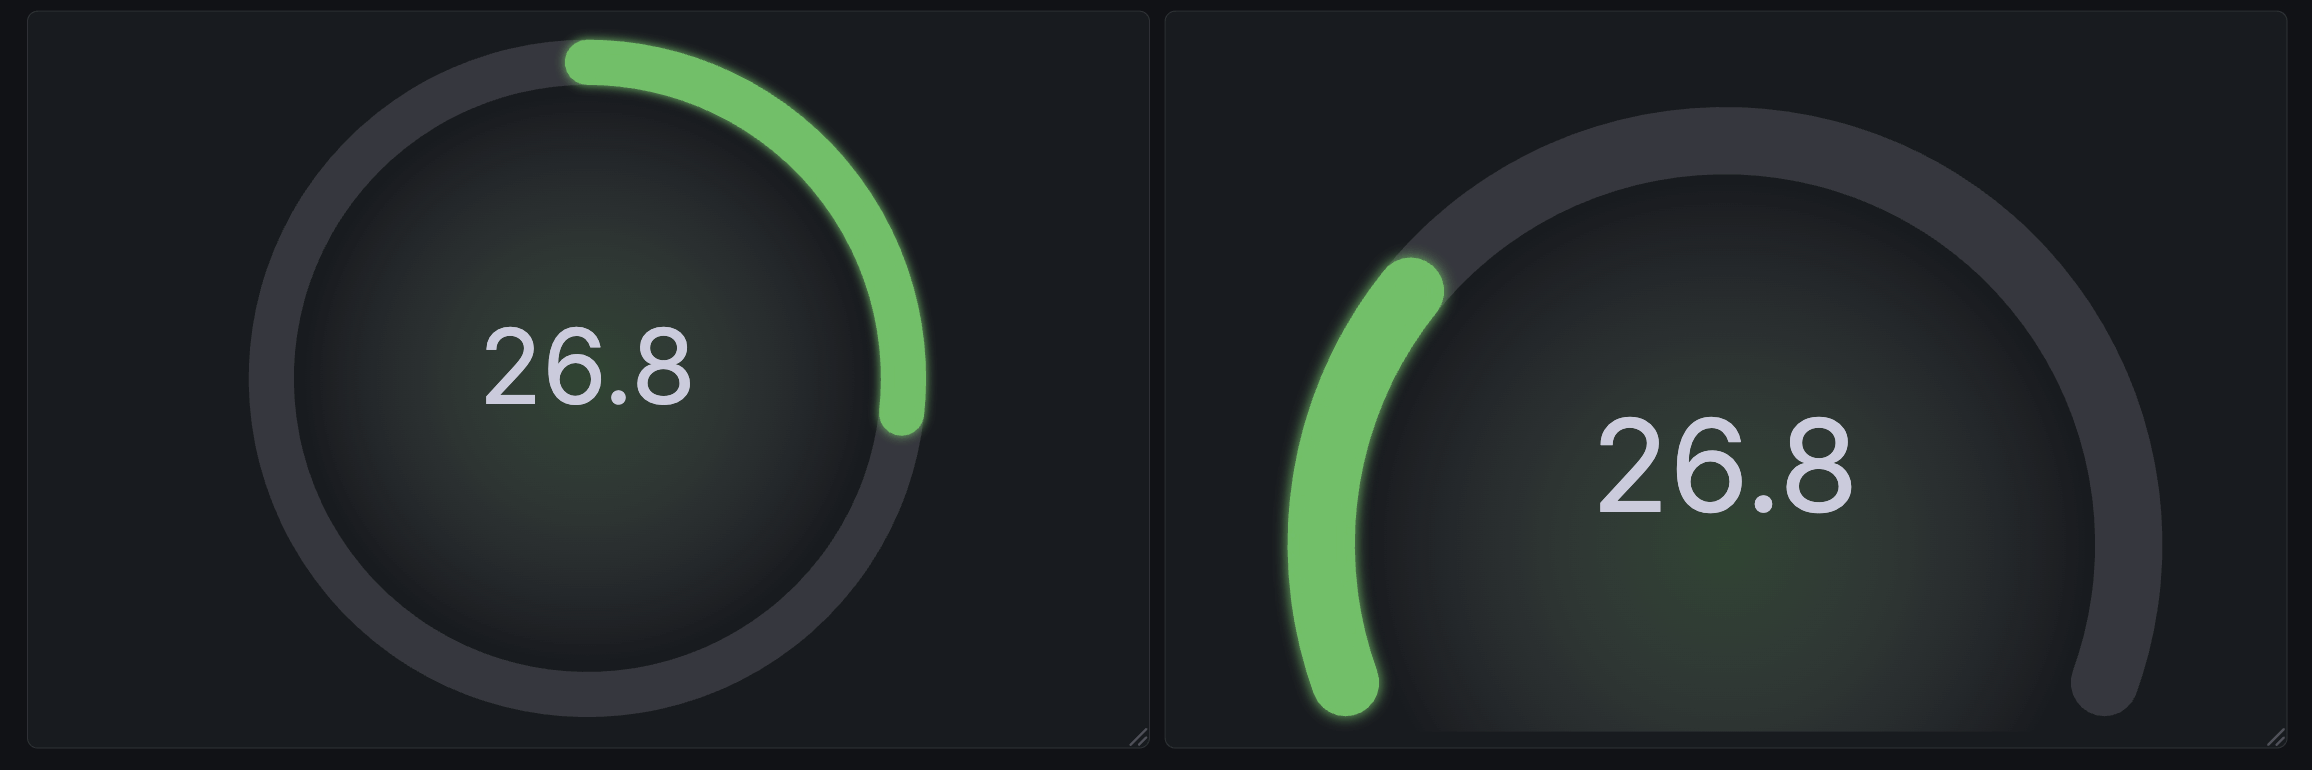
We’ve reimagined the gauge visualization to provide more options and several new variations to make your dashboards more informative and more appealing.
The Circular shape has been introduced as an alternative to the existing Arc gauge under the new Style option.
Grafana CloudExperimentalOpen sourceEnterpriseExperimental
Dashboards and visualizations
The datagrid visualization is deprecated after spending roughly three years in an experimental state. While existing panels that use datagrid will continue to function, it will no longer be available for creating new panels. We strongly encourage you to begin migrating to the table visualization ahead of Grafana 13.0, at which point the datagrid will be fully removed.
Grafana CloudGenerally AvailableEnterpriseGenerally Available
Authentication and authorizationSecurity
Never wait for a login to secure your stack
You can now automate your entire user lifecycle and team structures directly from your identity provider (IdP). By moving SCIM from public preview to general availability, we’ve removed the “first login” bottleneck, allowing centralized operators to provision, configure, and secure users before they even open the app.
Grafana CloudGenerally AvailableOpen sourceEnterpriseGenerally Available
Data sources
Security teams using CrowdStrike’s Falcon NextGen SIEM now have a direct path to visualize their security data in Grafana. With dedicated NGSIEM mode, connect via OAuth2 client credentials and bring your security investigations and incident data directly into your existing Grafana dashboards for unified observability and threat analysis. Get started by selecting NGSIEM mode in your data source configuration and learn more in the configuration documentation.
Grafana CloudGenerally AvailableOpen sourceEnterpriseGenerally Available
Data sources
Using the Google Sheets data source in Grafana is all about speed and flexibility, but one recurring friction point was having to reselect the same spreadsheet every time the data source was used.
Grafana CloudGenerally AvailableOpen sourceEnterpriseGenerally Available
This latest release of Grafana Zabbix Data Source delivers two major benefits: broader sharing capabilities and improved stability and performance for a smoother monitoring experience.
Grafana now provides smarter defaults for browsing OpenTelemetry log lines, optimized for the way OpenTelemetry structures log data.
What changed
OpenTelemetry log producers send less information in the log body and more data as structured metadata, or key–value pairs for resource attributes, log fields, and log attributes. Previously, much of this information was only visible when expanding a log line, making important context easy to miss.
Grafana CloudAvailable in public previewOpen sourceEnterpriseAvailable in public preview
Logs Drilldown
You can now configure default columns for Logs Drilldown directly from the plugin configuration page.
This new capability allows administrators to define which fields (or columns) are displayed by default based on the selected set of labels. Instead of relying on a static column setup, the logs view can now support a pre-configured default state per service, or set of services, ensuring users immediately see the most relevant information for their use case.
Grafana CloudGenerally AvailableOpen sourceEnterpriseGenerally Available
Alerting
Pending periods have been added to NoData and Error alert states in Alerting to help reduce noise by preventing notifications triggering after first evaluation and giving you more granular control. Now, NoData and Error alerts honor the same pending period as regular alerts. Notifications are sent only after the pending period elapses.
Open sourceEnterpriseGenerally Available
Dashboards and visualizationsBreaking change
We’re excited to introduce unified storage for playlists in self-managed Grafana!
When Grafana v12.4 starts, the migration system automatically transfers your playlists from the legacy SQL database to unified storage and validates data integrity after the migration completes.
Grafana CloudGenerally AvailableOpen sourceEnterpriseGenerally Available
Dashboards and visualizationsBreaking change
If your instance is small, Grafana now automatically migrates your folders and dashboards to Unified Storage. While this migration won’t have any visible change in the system, it will prepare you for upcoming storage improvements with zero configuration required.
Open sourceEnterpriseGenerally Available
PluginsBreaking change
Starting in Grafana v12.4, plugin processes no longer receive all host environment variables by default. This change improves security by limiting plugin access to environment variables from the Grafana host process.