This is documentation for the next version of Grafana documentation. For the latest stable release, go to the latest version.
Configure the InfluxDB data source
Learn how to configure the InfluxDB data source and explore the available configuration options.
Before you begin
To configure the InfluxDB data source, you must have the Administrator role.
InfluxData provides three query languages:
- Flux - A functional data scripting language for InfluxDB 2.x. Refer to Query InfluxDB with Flux for a basic guide on working with Flux.
- InfluxQL - A SQL-like query language developed by InfluxData. It doesn’t support advanced functions such as JOINs.
- SQL - Native SQL language available for InfluxDB v3.x.
To help choose the best language for your needs, refer to a comparison of Flux vs InfluxQL and Why InfluxData created Flux.
If you’re unsure which InfluxDB product you’re using, refer to InfluxData’s InfluxDB product detection tool for guidance.
Add the InfluxDB data source
Complete the following steps to set up a new InfluxDB data source:
- Click Connections in the left-side menu.
- Click Add new connection.
- Type
InfluxDBin the search bar. - Select the InfluxDB data source.
- Click Add new data source in the upper right.
Grafana opens the Settings tab where you configure the data source. A sidebar on the left displays navigation links to each configuration section:
- URL and authentication
- Database settings
- Private data source connect (optional, Grafana Cloud only)
- Save & test
Configuration options
The following sections describe the available configuration options.
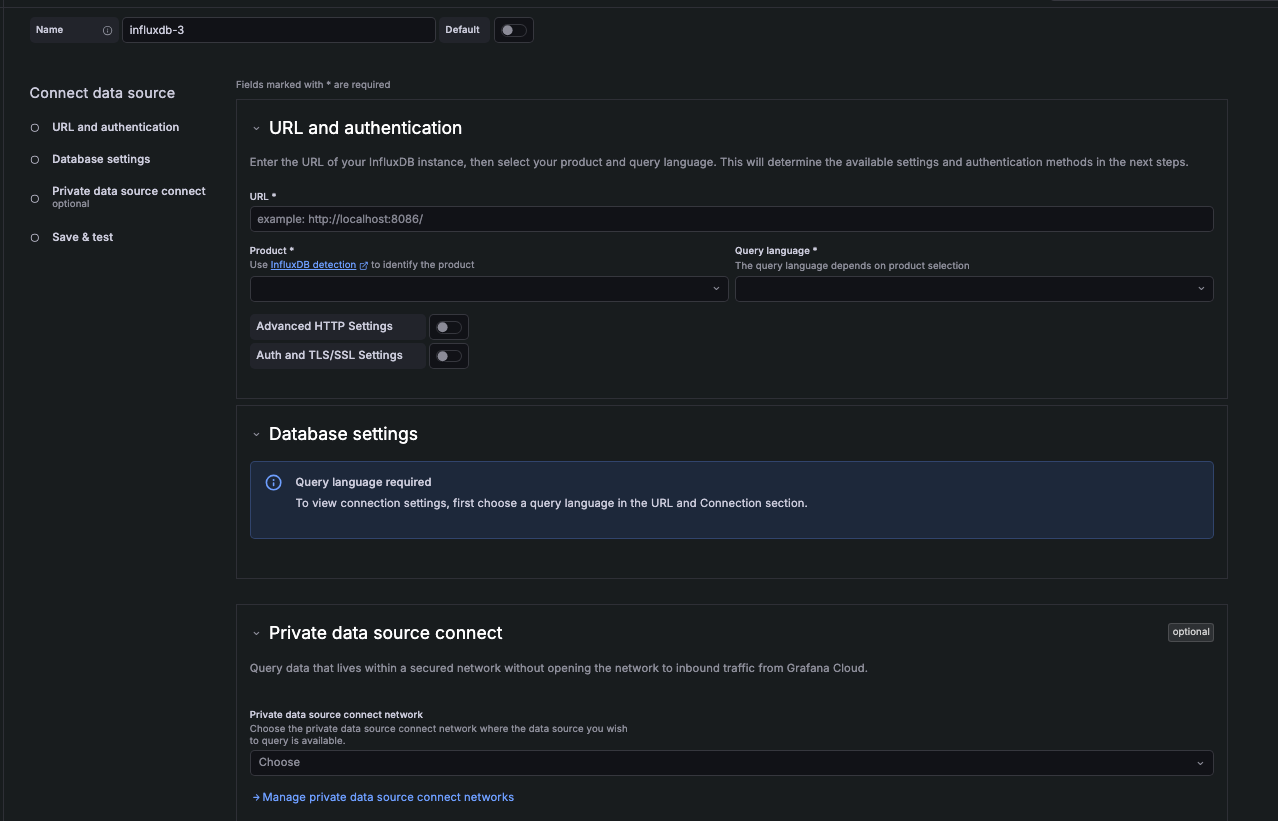
First, configure the name of your connection.
- Name - Sets the name you use to refer to the data source in panels and queries. Examples:
InfluxDB-InfluxQL,InfluxDB_SQL. - Default - Toggle to set as the default data source.
URL and authentication
Use these settings to specify the InfluxDB instance the data source connects to.
- URL - The HTTP protocol, IP address, and port of your InfluxDB API. The InfluxDB default API port is
8086. When you enter a URL, Grafana attempts to auto-detect your InfluxDB product based on URL patterns. Refer to InfluxDB detection for more information. - Product - Select the InfluxDB product you’re connecting to. The available query languages depend on your product selection.
- Query language - Select the query language for your InfluxDB instance. This determines the connection details needed in Database settings. The available options are:
- Flux - Flux is a data scripting language developed by InfluxData that allows you to query, analyze, and act on data. Refer to Get started with Flux for guidance on using Flux.
- InfluxQL - SQL-like language for querying InfluxDB, with statements such as SELECT, FROM, WHERE, and GROUP BY that are familiar to SQL users.
- SQL - Native SQL language starting with InfluxDB v3.0. Refer to InfluxData’s SQL reference documentation for a list of supported statements, operators, and functions.
The following table shows which query languages are available for each InfluxDB product:
Note
For InfluxQL only. Database + Retention Policy (DBRP) Mapping must be configured before data can be queried for the following products: InfluxDB OSS 1.x, InfluxDB OSS 2.x, InfluxDB Enterprise 1.x, InfluxDB Cloud (TSM), InfluxDB Cloud Serverless.
Refer to Manage DBRP Mappings for guidance on setting this up using the CLI or API.
Advanced HTTP settings
Toggle Advanced HTTP Settings to expand optional settings for more control over your data source.
- Allowed cookies - Defines which cookies are forwarded to the data source. All other cookies are deleted by default.
- Timeout - Set an HTTP request timeout in seconds.
Custom HTTP headers
Click + Add header to add one or more HTTP headers. HTTP headers pass additional context and metadata about the request/response.
- Header - Add a custom HTTP header. Select an option from the drop-down. Allows custom headers to be passed based on the needs of your InfluxDB instance.
- Value - The value for the header.
Auth and TLS/SSL settings
Toggle Auth and TLS/SSL Settings to expand authentication and security options.
- No Authentication - Make the data source available without authentication. Grafana recommends using some type of authentication method.
- Basic auth - The most common authentication method. Use your InfluxDB instance username and password to authenticate.
- Forward OAuth identity - Forward the OAuth access token (and also the OIDC ID token if available) of the user querying the data source.
- With credentials - Toggle to enable credentials such as cookies or auth headers to be sent with cross-site requests.
TLS/SSL Certificates are encrypted and stored in the Grafana database.
- TLS client auth - When enabled, add the
Server name,Client certandClient key. The client provides a certificate that the server validates to establish the client’s trusted identity. The client key encrypts the data between client and server.- Server name - Name of the server. Example:
server1.domain.com - Client cert - Add the client certificate.
- Client key - Add the client key.
- Server name - Name of the server. Example:
- CA cert - Authenticate with a CA certificate. When enabled, follow the instructions of your CA (Certificate Authority) to download the certificate file.
- Skip TLS verify - Toggle to bypass TLS certificate validation.
Database settings
Note
Setting the database for this data source does not deny access to other databases. The InfluxDB query syntax allows switching the database in the query. For example:
SHOW MEASUREMENTS ON _internalorSELECT * FROM "_internal".."database" LIMIT 10To support data isolation and security, make sure appropriate permissions are configured in InfluxDB.
Use these settings to specify the InfluxDB database your data source connects to. The required fields vary based on the query language selected in URL and authentication.
The following table shows which fields are required for each query language:
- Organization - Sets the InfluxDB organization used for Flux queries. Also used for the
v.organizationquery macro. - Default Bucket - The InfluxDB bucket used for the
v.defaultBucketmacro in Flux queries. - Database - Sets the database name to query. Refer to View buckets in InfluxData’s documentation on how to locate the list of available buckets and their corresponding IDs.
- User - The username used to sign in to InfluxDB.
- Password - The password for the specified user. Used with InfluxQL queries.
- Token - The authentication token used to query InfluxDB. Retrieve this from the Tokens page in the InfluxDB UI.
For Flux
- With InfluxDB 2.x products, use the InfluxDB authentication token.
- For InfluxDB 1.8, the token is
username:password.
Advanced database settings
Toggle Advanced Database Settings to expand optional settings that give you more control over the query experience.
- Max series - Sets a limit on the maximum number of series or tables that Grafana processes. Set a lower limit to prevent system overload, or increase it if you have many small time series and need to display more of them. The default is
1000.
For Flux and InfluxQL
- Min time interval - Sets the minimum time interval for auto group-by. Grafana recommends setting this to match the data write frequency. For example, if your data is written every minute, it’s recommended to set this interval to 1 minute, so that each group contains data from each new write. The default is
10s. Refer to Min time interval for format examples.
For InfluxQL
- HTTP method - Sets the HTTP method used to query your data source. The POST method allows for larger queries that would return an error using the GET method. The default method is
POST. - Autocomplete range - Sets a time range limit for the query editor’s autocomplete to reduce the execution time of tag filter queries. As a result, any tags not present within the defined time range will be filtered out. For example, setting the value to 12h will include only tag keys/values from the past 12 hours. This feature is recommended for use with very large databases, where significant performance improvements can be observed.
For SQL
- Insecure Connection - Toggle to disable gRPC TLS security.
Private data source connect
For Grafana Cloud only. Private data source connect (PDC) allows you to establish a private, secured connection between a Grafana Cloud instance and data sources secured within a private network. For more information, refer to Private data source connect (PDC).
Click Manage private data source connect to go to your PDC connection page, where you’ll find your PDC configuration details.
Save and test
After you have configured your connection settings, click Save & test to validate the data source connection.
A successful test returns one of the following messages depending on your query language:
If the test fails, refer to Troubleshoot InfluxDB data source issues for help resolving common connection and authentication errors.
Min time interval
The Min time interval setting defines a lower limit for the auto group-by time interval.
This value must be formatted as a number followed by a valid time identifier:
You can also override this setting in a dashboard panel under its data source options.
Provision the InfluxDB data source
You can define and configure the data source in YAML files as part of the Grafana provisioning system. For more information about provisioning, and for available configuration options, refer to Provision Grafana.
Note
The
databasefield is deprecated. Grafana recommends using thedbNamefield injsonData. There is no need to change existing provisioning settings.
Provisioning examples
Provisioning differs based on query language.
InfluxDB 1.x example:
apiVersion: 1

datasources:
  - name: InfluxDB_v1
    type: influxdb
    access: proxy
    user: grafana
    url: http://localhost:8086
    jsonData:
      dbName: site
      httpMode: GET
    secureJsonData:
      password: grafana
InfluxDB 2.x for Flux example:
apiVersion: 1

datasources:
  - name: InfluxDB_v2_Flux
    type: influxdb
    access: proxy
    url: http://localhost:8086
    jsonData:
      version: Flux
      organization: organization
      defaultBucket: bucket
      tlsSkipVerify: true
    secureJsonData:
      token: token
InfluxDB 2.x for InfluxQL example:
apiVersion: 1

datasources:
  - name: InfluxDB_v2_InfluxQL
    type: influxdb
    access: proxy
    url: http://localhost:8086
    jsonData:
      dbName: site
      httpHeaderName1: 'Authorization'
    secureJsonData:
      httpHeaderValue1: 'Token <token>'
InfluxDB 3.x for SQL example:
apiVersion: 1

datasources:
  - name: InfluxDB_v3_SQL
    type: influxdb
    access: proxy
    url: http://localhost:8086
    jsonData:
      version: SQL
      dbName: site
      httpMode: POST
      insecureGrpc: false
    secureJsonData:
      token: '<api-token>'
Configure the data source with Terraform
You can configure the InfluxDB data source using the Grafana Terraform provider.
Terraform prerequisites
Before you begin, you need:
- Terraform installed
- Grafana Terraform provider configured with appropriate credentials
- For Grafana Cloud: A Cloud Access Policy token with data source permissions
Provider configuration
Configure the Grafana provider to connect to your Grafana instance:
terraform {
  required_providers {
    grafana = {
      source  = "grafana/grafana"
      version = ">= 2.0.0"
    }
  }
}

# For Grafana Cloud
provider "grafana" {
  url  = "<YOUR_GRAFANA_CLOUD_STACK_URL>"
  auth = "<YOUR_SERVICE_ACCOUNT_TOKEN>"
}

# For self-hosted Grafana
# provider "grafana" {
#   url  = "http://localhost:3000"
#   auth = "<API_KEY_OR_SERVICE_ACCOUNT_TOKEN>"
# }
Terraform examples
The following examples show how to configure the InfluxDB data source for each query language.
InfluxDB 2.x with Flux:
resource "grafana_data_source" "influxdb_flux" {
  type = "influxdb"
  name = "InfluxDB_Flux"
  url  = "http://localhost:8086"

  json_data_encoded = jsonencode({
    version       = "Flux"
    organization  = "<ORGANIZATION>"
    defaultBucket = "<DEFAULT_BUCKET>"
    tlsSkipVerify = false
  })

  secure_json_data_encoded = jsonencode({
    token = "<API_TOKEN>"
  })
}
InfluxDB 1.x with InfluxQL:
resource "grafana_data_source" "influxdb_influxql" {
  type = "influxdb"
  name = "InfluxDB_InfluxQL"
  url  = "http://localhost:8086"

  basic_auth_enabled  = true
  basic_auth_username = "<USERNAME>"

  json_data_encoded = jsonencode({
    dbName   = "<DATABASE>"
    httpMode = "POST"
  })

  secure_json_data_encoded = jsonencode({
    basicAuthPassword = "<PASSWORD>"
  })
}
InfluxDB 2.x with InfluxQL (token auth):
resource "grafana_data_source" "influxdb_v2_influxql" {
  type = "influxdb"
  name = "InfluxDB_v2_InfluxQL"
  url  = "http://localhost:8086"

  json_data_encoded = jsonencode({
    dbName          = "<DATABASE>"
    httpHeaderName1 = "Authorization"
  })

  secure_json_data_encoded = jsonencode({
    httpHeaderValue1 = "Token <API_TOKEN>"
  })
}
InfluxDB 3.x with SQL:
resource "grafana_data_source" "influxdb_sql" {
  type = "influxdb"
  name = "InfluxDB_SQL"
  url  = "http://localhost:8086"

  json_data_encoded = jsonencode({
    version      = "SQL"
    dbName       = "<DATABASE>"
    httpMode     = "POST"
    insecureGrpc = false
  })

  secure_json_data_encoded = jsonencode({
    token = "<API_TOKEN>"
  })
}
For more information about the Grafana Terraform provider, refer to the Terraform provider documentation.


