This is documentation for the next version of Grafana documentation. For the latest stable release, go to the latest version.
Configure the Azure Monitor data source
This document explains how to configure the Azure Monitor data source and the available configuration options. For general information about data sources, refer to Grafana data sources and Data source management.
Before you begin
Before configuring the Azure Monitor data source, ensure you have the following:
Grafana permissions: You must have the
Organization administratorrole to configure data sources. Organization administrators can also configure the data source via YAML with the Grafana provisioning system or using Terraform.Azure prerequisites: Depending on your chosen authentication method, you may need:
- A Microsoft Entra ID (formerly Azure AD) app registration with a service principal (for App Registration authentication)
- A Managed Identity enabled on your Azure VM or App Service (for Managed Identity authentication)
- Workload identity configured in your Kubernetes cluster (for Workload Identity authentication)
- Microsoft Entra ID authentication configured for Grafana login (for Current User authentication)
Note
Grafana Cloud users: Managed Identity and Workload Identity authentication methods are not available in Grafana Cloud because they require Grafana to run on your Azure infrastructure. Use App Registration authentication instead.
- Azure RBAC permissions: The identity used to authenticate must have the
Readerrole on the Azure subscription containing the resources you want to monitor. For Log Analytics queries, the identity also needs appropriate permissions on the Log Analytics workspaces to be queried. Refer to the Azure documentation for role assignments.
Note
The Azure Monitor data source plugin is built into Grafana. No additional installation is required.
Add the data source
To add the Azure Monitor data source:
- Click Connections in the left-side menu.
- Click Add new connection.
- Type
Azure Monitorin the search bar. - Select Azure Monitor.
- Click Add new data source in the upper right.
You’re taken to the Settings tab where you can configure the data source.
Choose an authentication method
The Azure Monitor data source supports four authentication methods. Choose based on where Grafana is hosted and your security requirements:
Configure authentication
Select one of the following authentication methods and complete the configuration.
App Registration (client secret)
Use a Microsoft Entra ID app registration (service principal) to authenticate. This method works with any Grafana deployment.
App Registration prerequisites
Create an app registration in Microsoft Entra ID. Refer to the Azure documentation for creating a service principal.
Create a client secret for the app registration. Refer to the Azure documentation for creating a client secret.
Assign the
Readerrole to the app registration on the subscription or resources you want to monitor. Refer to the Azure documentation for role assignments.
App Registration UI configuration
Provision App Registration with YAML
apiVersion: 1

datasources:
  - name: Azure Monitor
    type: grafana-azure-monitor-datasource
    access: proxy
    jsonData:
      azureAuthType: clientsecret
      cloudName: azuremonitor # See supported cloud names below
      tenantId: <tenant-id>
      clientId: <client-id>
      subscriptionId: <subscription-id> # Optional, default subscription
    secureJsonData:
      clientSecret: <client-secret>
    version: 1
App Registration (client certificate)
Use a Microsoft Entra ID app registration with a certificate.
App Registration (client certificate) prerequisites
- Create an app registration in Microsoft Entra ID. Refer to the Azure documentation for creating a service principal.
- Create or retrieve an existing certificate (see examples below for creating self-signed PEM or PFX certificates).
- Upload a certificate to the app registration in PEM or PFX format. Refer to the Azure documentation here.
- Assign the
Readerrole to the app registration on the subscription or resources you want to monitor. Refer to the Azure documentation for role assignments.
Add the certificate to the app registration
Add the public certificate to your app registration in the Azure portal:
- Open the app registration in Azure.
- Select Certificates & secrets.
- Select Certificates.
- Click Upload certificate.
- Upload the certificate file that contains the public certificate (
.cer,.crt, or.pem). - Save your changes.
The uploaded certificate is used by Microsoft Entra ID to validate the client assertion signature from Grafana.
Certificate formats
The Azure Monitor data source supports the following certificate formats:
- PEM: Provide both the certificate and private key in PEM text format.
- PFX: Provide a base64-encoded PFX payload in the Client Certificate field, and provide the certificate password.
Create self-signed certificates
The following examples are for test and lab environments. For production, use certificates from your internal or public certificate authority.
Create a self-signed PEM certificate and private key with OpenSSL:
openssl genrsa -out key.pem 2048
openssl req -new -sha256 -key key.pem -out csr.csr
openssl req -x509 -sha256 -days 365 -key key.pem -in csr.csr -out certificate.pem
In this example:
certificate.pemis uploaded to Certificates & secrets in Azure.certificate.pemis the client certificate added to Grafana.key.pemis the private key added to Grafana.
Create an encrypted, base64 encoded PFX certificate:
openssl genrsa -out key.pem 2048
openssl req -new -sha256 -key key.pem -out csr.csr
openssl req -x509 -sha256 -days 365 -key key.pem -in csr.csr -out certificate.pem
openssl pkcs12 -export -inkey key.pem -in certificate.pem -out certificate.pfx
openssl base64 -in certificate.pfx -out certificate.b64
Ensure you make note of the password you use to encrypt the certificate.
In this example:
certificate.pemis uploaded to Certificates & secrets in Azure.certificate.b64is the encrypted, encoded file added to Grafana (in the client certificate field).
App Registration (client certificate) UI configuration
Provision App Registration (client certificate) with YAML
To provision the Azure Monitor data source with client certificate authentication, use the following configuration:
apiVersion: 1

datasources:
  - name: Azure Monitor
    type: grafana-azure-monitor-datasource
    access: proxy
    jsonData:
      azureAuthType: clientcertificate
      cloudName: azuremonitor # See supported cloud names below
      tenantId: <tenant-id>
      clientId: <client-id>
      certificateFormat: pem # Use pem or pfx
      subscriptionId: <subscription-id> # Optional, default subscription
    secureJsonData:
      clientCertificate: <certificate-content>
      privateKey: <private-key-content> # pem only
      certificatePassword: <certificate-password> # pfx only, if set
    version: 1
Managed Identity
Use Azure Managed Identity for secure, credential-free authentication when Grafana is hosted in Azure.
Note
Managed Identity is available in Azure Managed Grafana or self-hosted Grafana deployed in Azure. It is not available in Grafana Cloud.
Managed Identity prerequisites
- Grafana must be hosted in Azure (App Service, Azure VMs, or Azure Managed Grafana).
- Managed identity must be enabled on the Azure resource hosting Grafana.
- The managed identity must have the
Readerrole on the subscription or resources you want to monitor.
For details on Azure managed identities, refer to the Azure documentation.
Managed Identity Grafana server configuration
Enable managed identity in the Grafana server configuration:
[azure]
managed_identity_enabled = true
To use a user-assigned managed identity instead of the system-assigned identity, also set:
[azure]
managed_identity_enabled = true
managed_identity_client_id = <USER_ASSIGNED_IDENTITY_CLIENT_ID>
Refer to Grafana Azure configuration for more details.
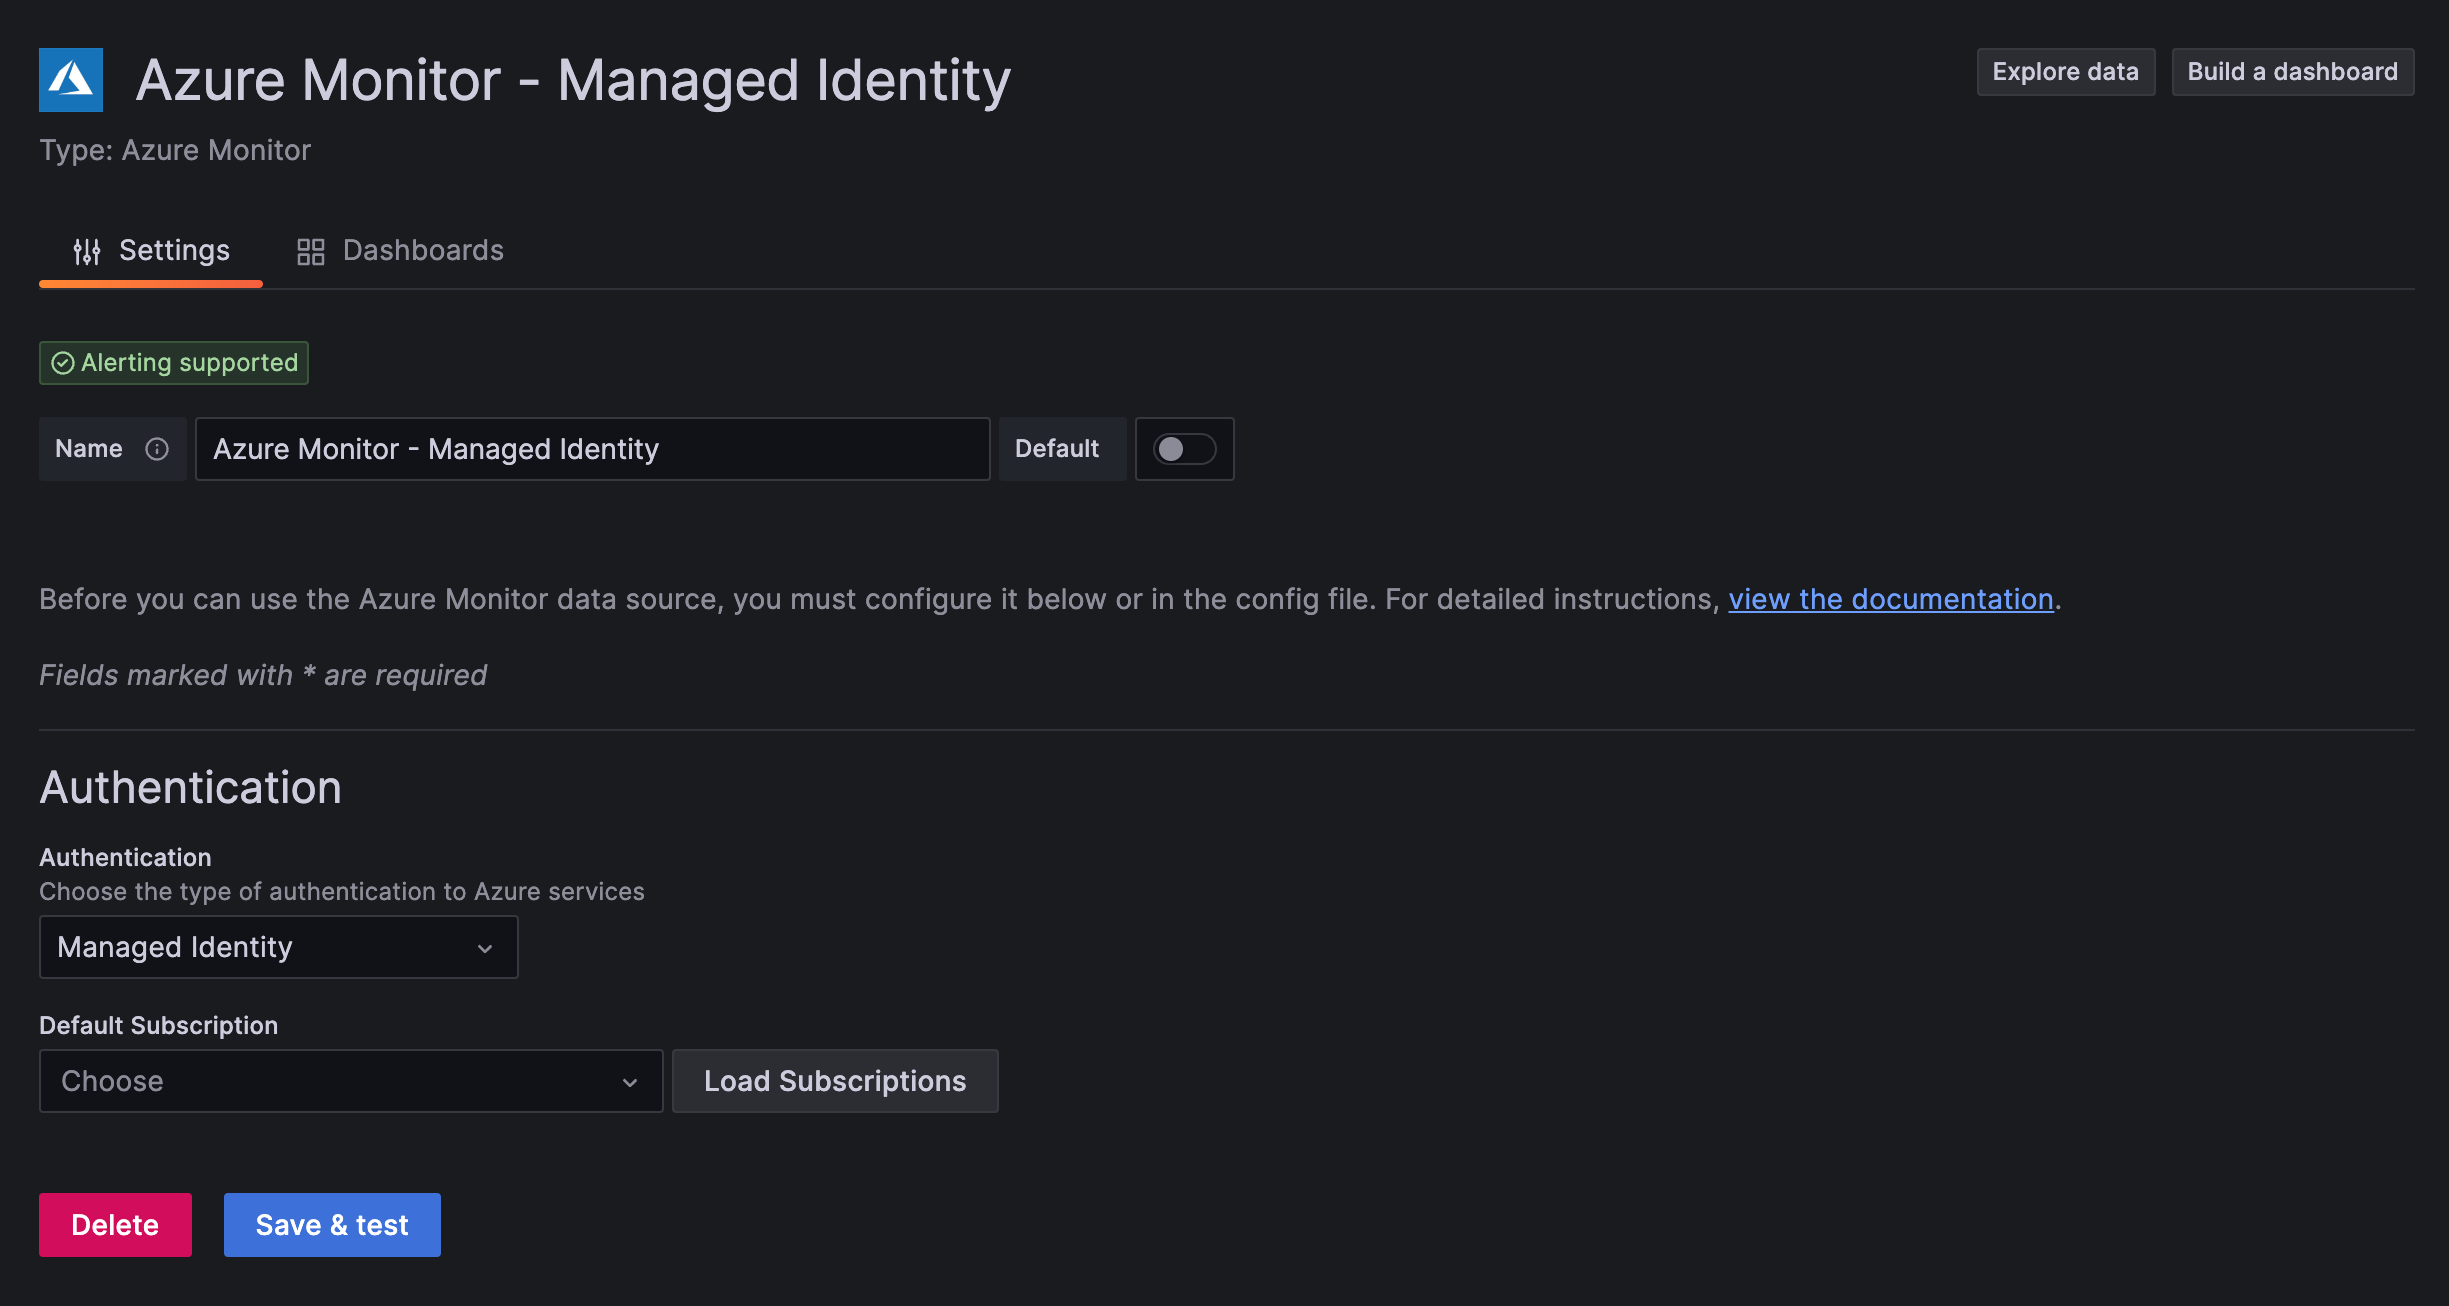
Managed Identity UI configuration

Provision Managed Identity with YAML
apiVersion: 1

datasources:
  - name: Azure Monitor
    type: grafana-azure-monitor-datasource
    access: proxy
    jsonData:
      azureAuthType: msi
      subscriptionId: <subscription-id> # Optional, default subscription
    version: 1
Workload Identity
Use Azure Workload Identity for secure authentication in Kubernetes environments like AKS.
Workload Identity prerequisites
- Grafana must be running in a Kubernetes environment with workload identity federation configured.
- The workload identity must have the
Readerrole on the subscription or resources you want to monitor.
For details, refer to the Azure workload identity documentation.
Workload Identity Grafana server configuration
Enable workload identity in the Grafana server configuration:
[azure]
workload_identity_enabled = true
Optional configuration variables:
[azure]
workload_identity_enabled = true
workload_identity_tenant_id = <IDENTITY_TENANT_ID>    # Microsoft Entra ID tenant containing the managed identity
workload_identity_client_id = <IDENTITY_CLIENT_ID>    # Client ID if different from default
workload_identity_token_file = <TOKEN_FILE_PATH>      # Path to the token file
Refer to Grafana Azure configuration and the Azure workload identity documentation for more details.
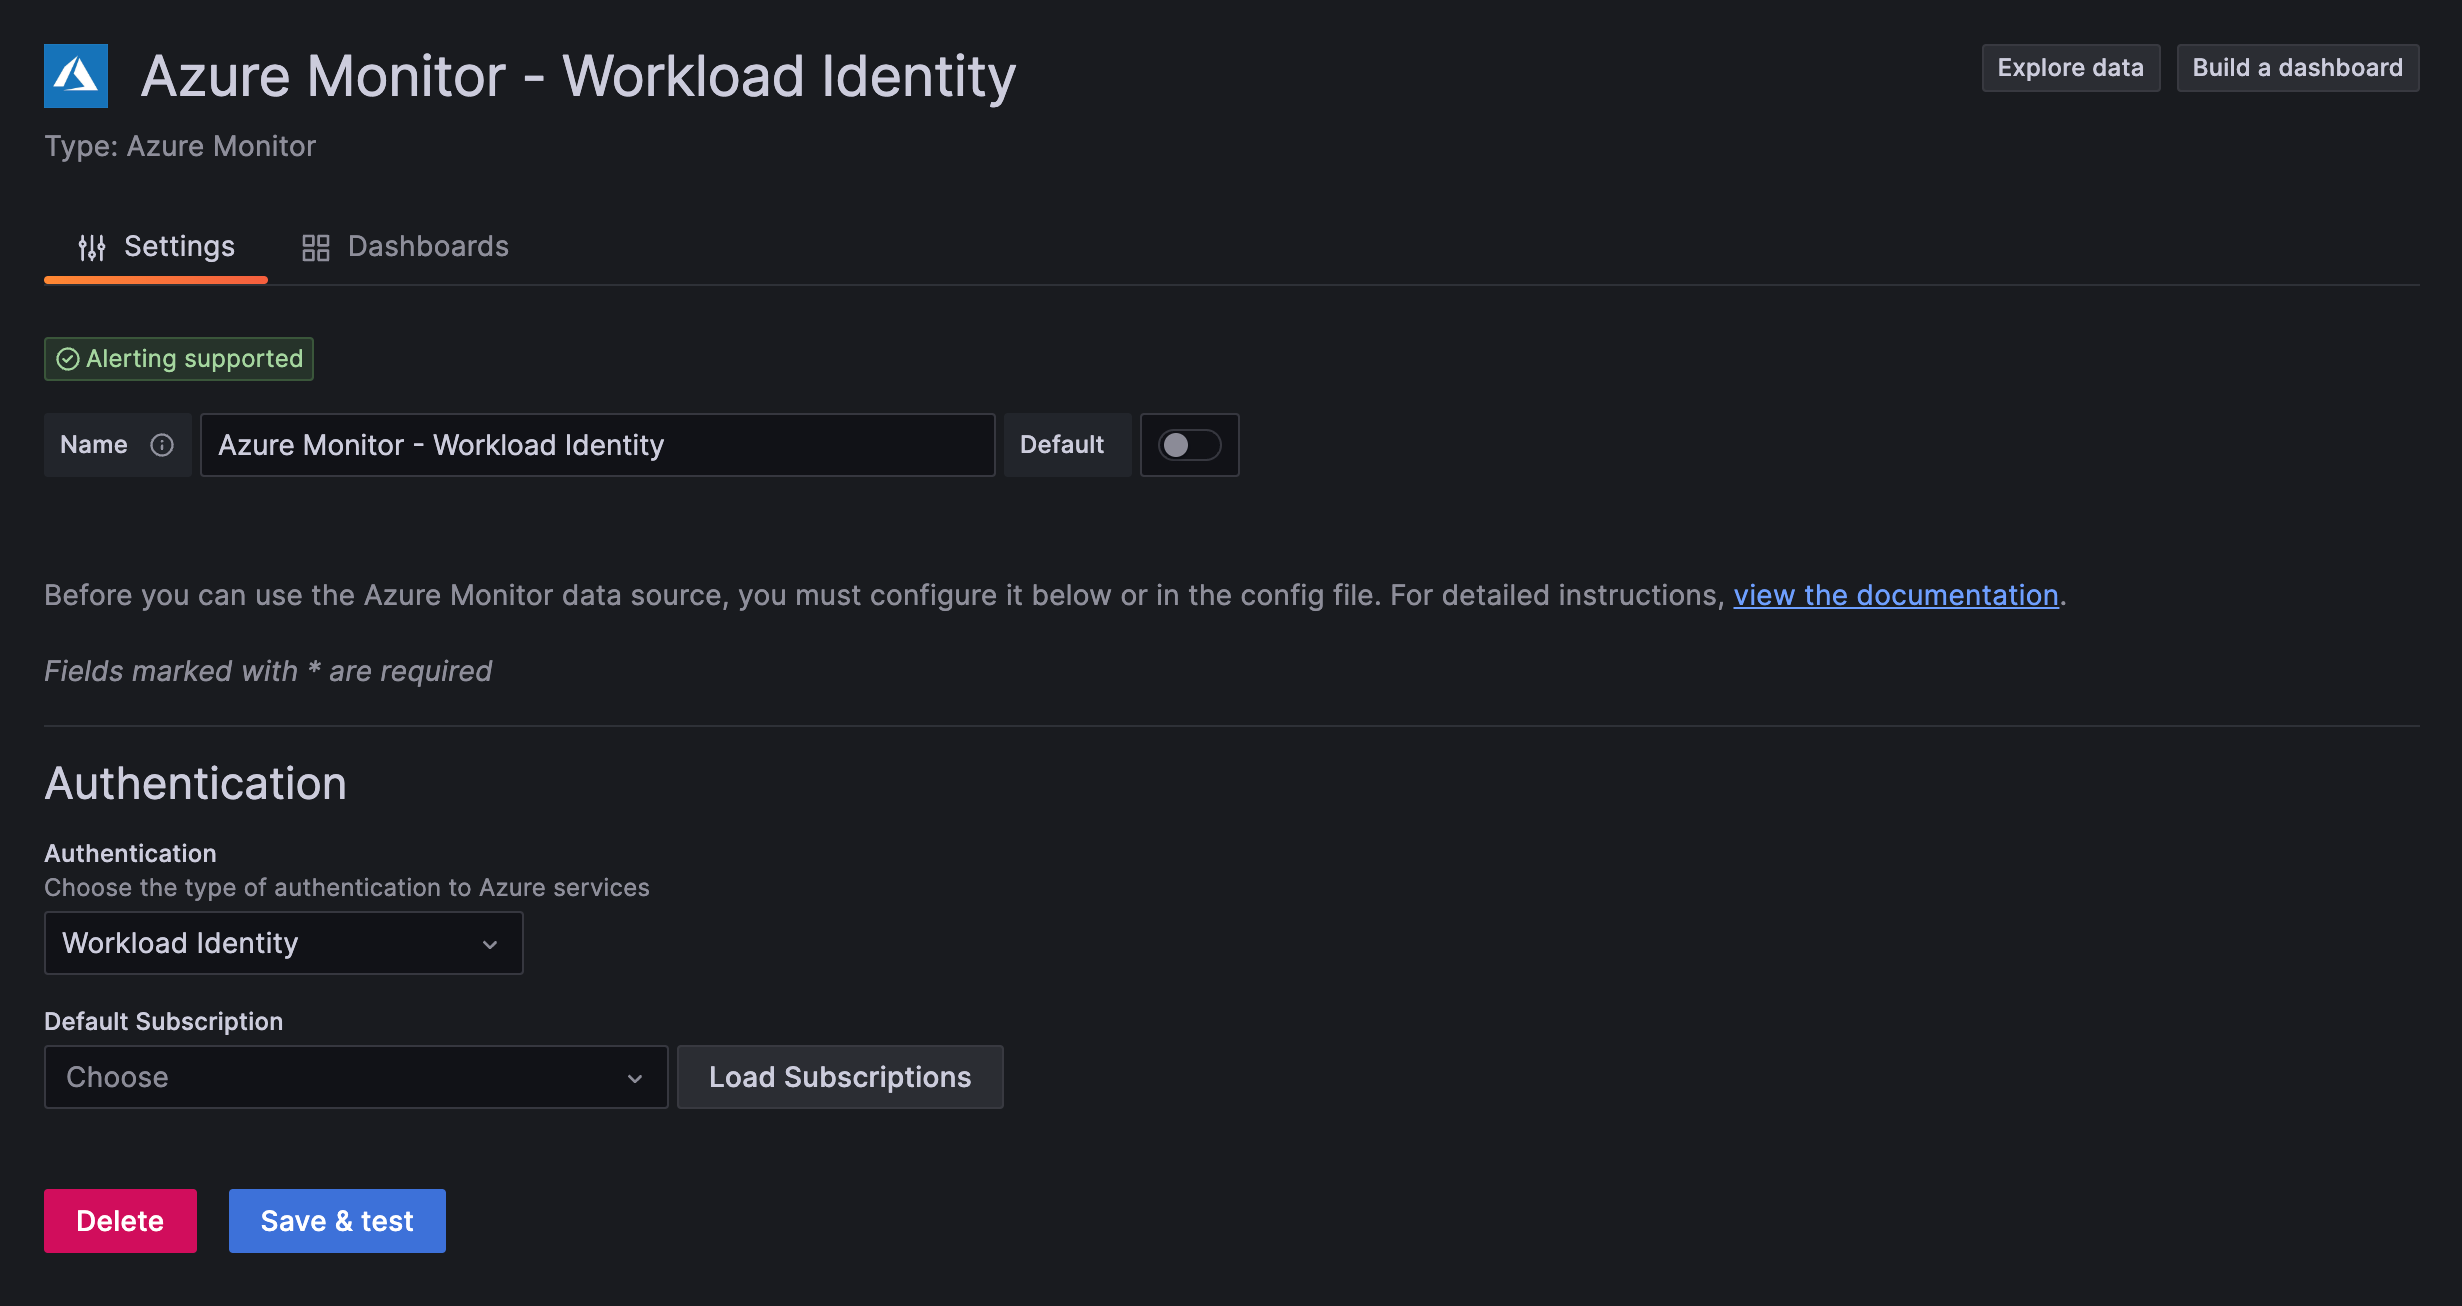
Workload Identity UI configuration

Provision Workload Identity with YAML
apiVersion: 1

datasources:
  - name: Azure Monitor
    type: grafana-azure-monitor-datasource
    access: proxy
    jsonData:
      azureAuthType: workloadidentity
      subscriptionId: <subscription-id> # Optional, default subscription
    version: 1
Current User
Forward the logged-in Grafana user’s Azure credentials to the data source for user-level access control.
Warning
Current User authentication is an experimental feature. Engineering and on-call support is not available. Documentation is limited. No SLA is provided. Contact Grafana Support to enable this feature in Grafana Cloud.
Current User prerequisites
Your Grafana instance must be configured with Microsoft Entra ID authentication. Refer to the Microsoft Entra ID authentication documentation.
Configure your Azure App Registration
The App Registration used for Grafana login requires additional configuration:
Enable token issuance:
- In the Azure Portal, open your App Registration.
- Select Authentication in the side menu.
- Under Implicit grant and hybrid flows, check both Access tokens and ID tokens.
- Save your changes.
Add API permissions:
- In the Azure Portal, open your App Registration.
- Select API Permissions in the side menu.
- Ensure these permissions are present under Microsoft Graph:
openid,profile,email, andoffline_access. - Add the following permissions:
- Azure Service Management > Delegated permissions >
user_impersonation - APIs my organization uses > Search for Log Analytics API > Delegated permissions >
Data.Read
- Azure Service Management > Delegated permissions >
Refer to the Azure documentation for more information.
Update Grafana scopes:
Update the scopes section in your Grafana Azure authentication configuration to include the .default scope:
.default openid email profileCurrent User Grafana server configuration
Enable current user authentication in the Grafana server configuration:
[azure]
user_identity_enabled = true
By default, this also enables fallback service credentials. To disable fallback credentials at the instance level:
[azure]
user_identity_enabled = true
user_identity_fallback_credentials_enabled = false
Note
To use fallback service credentials, the feature toggle
idForwardingmust be set totrue.
Limitations and fallback credentials
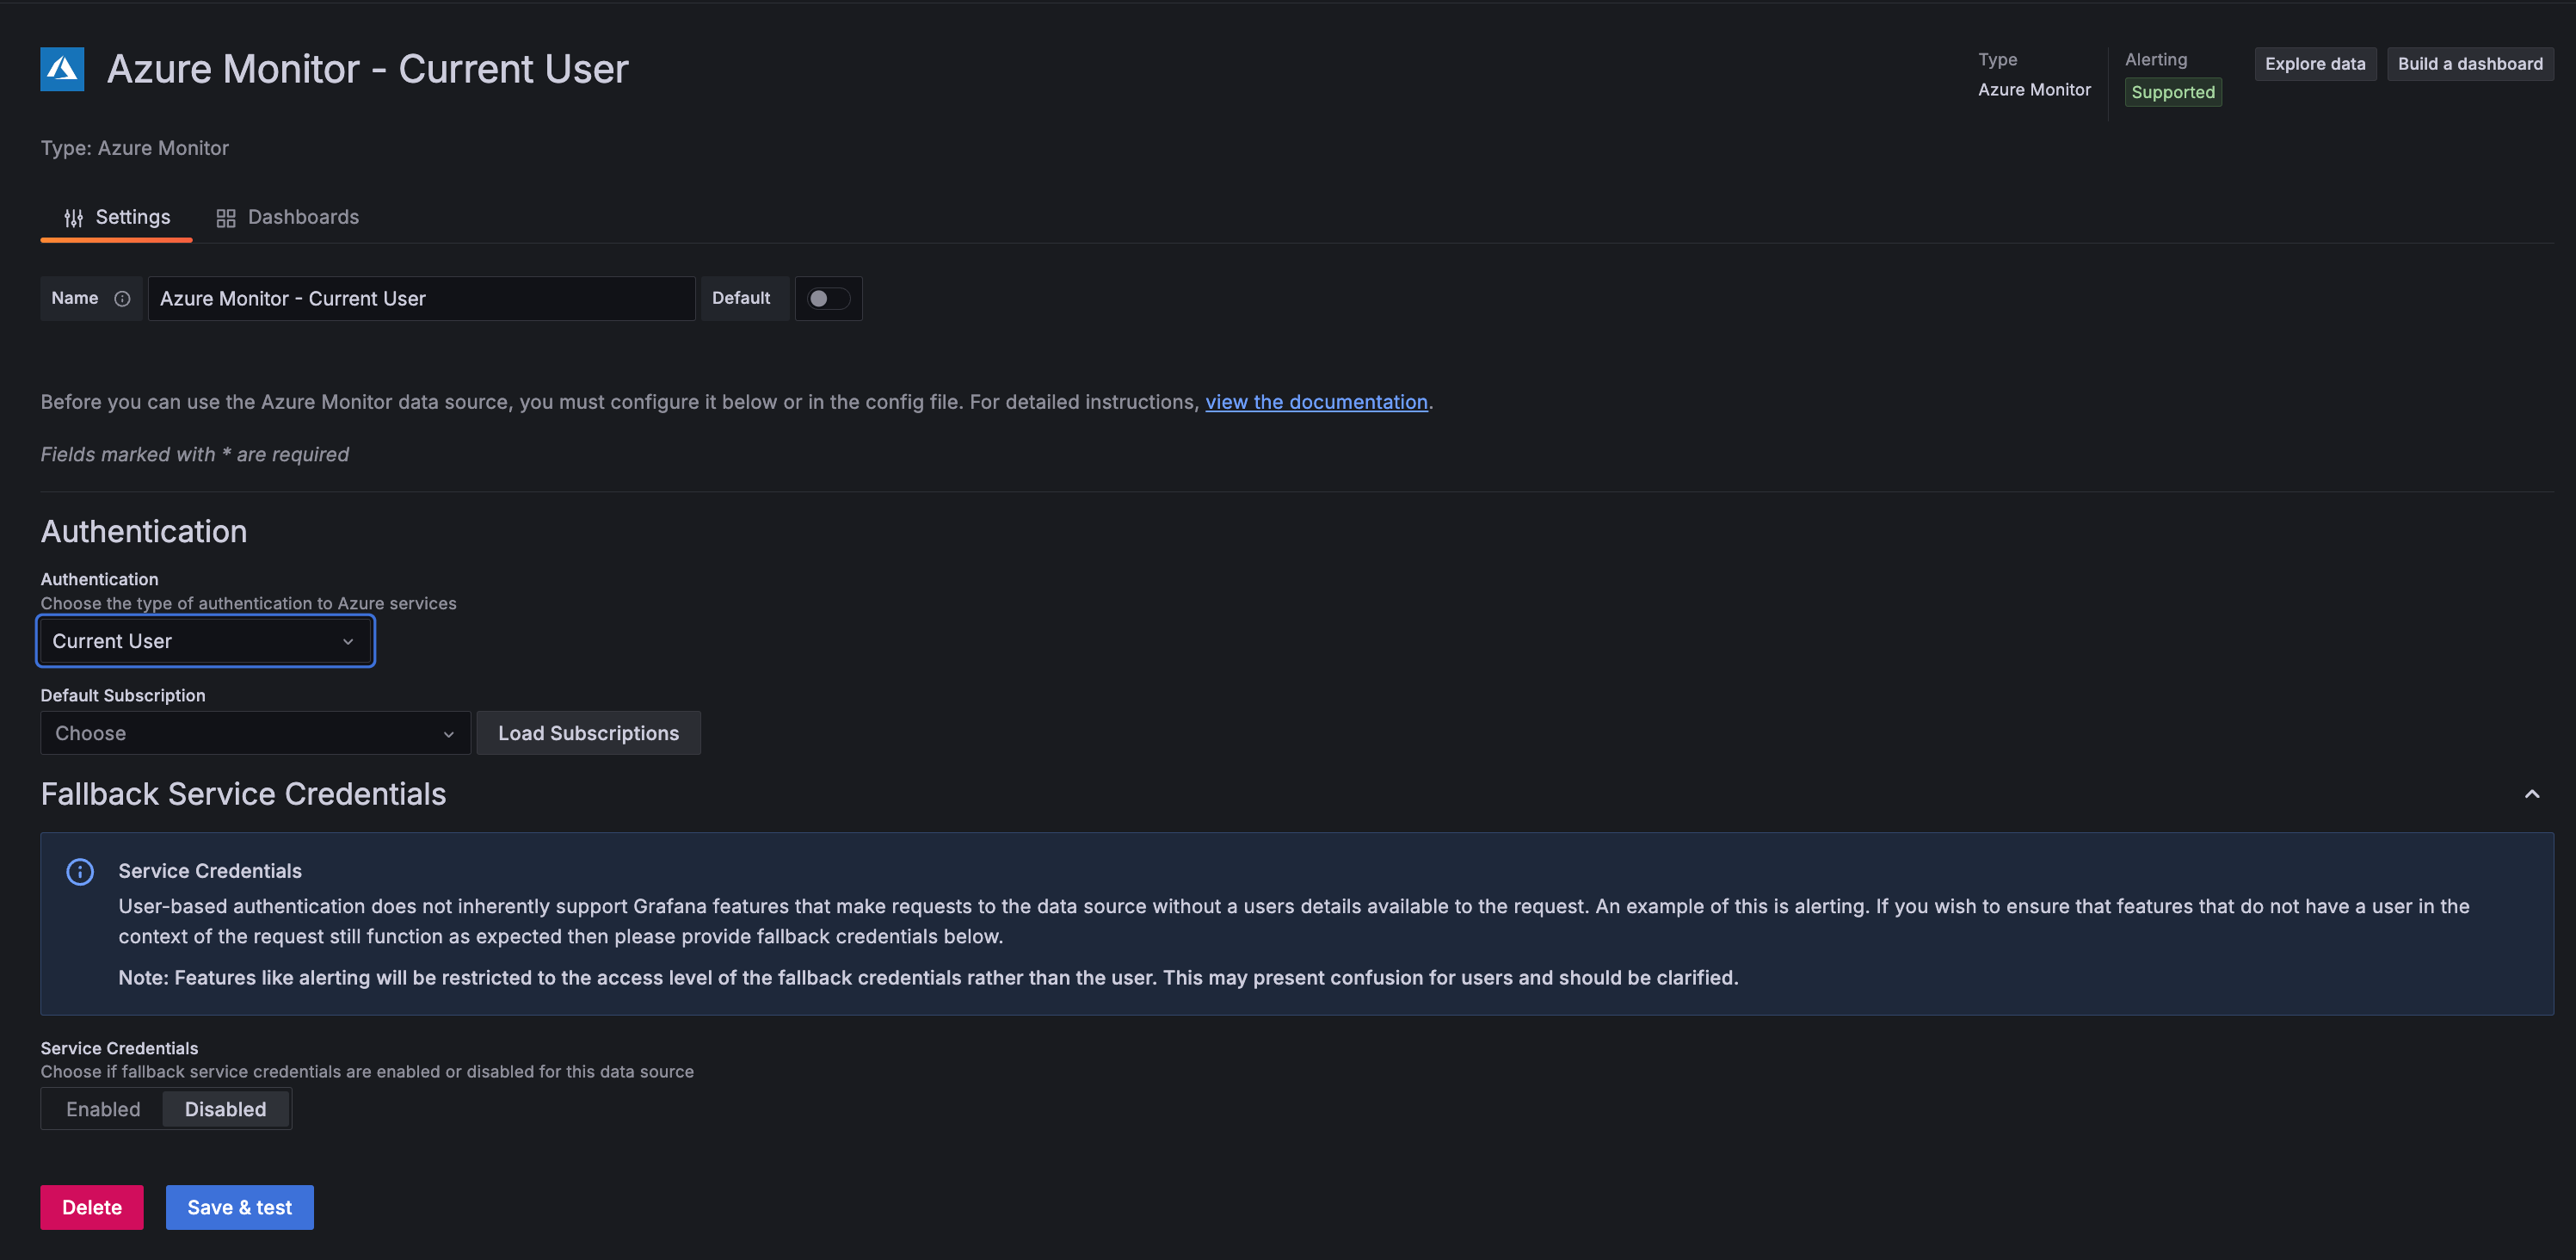
Current User authentication doesn’t support backend functionality like alerting, reporting, and recorded queries because user credentials aren’t available for background operations.
To support these features, configure fallback service credentials. When enabled, Grafana uses the fallback credentials for backend operations. Note that operations using fallback credentials are limited to the permissions of those credentials, not the user’s permissions.
Note
Query and resource caching is disabled by default for data sources using Current User authentication.
Current User UI configuration

Provision Current User with YAML
Note
The
oauthPassThruproperty is required for Current User authentication. ThedisableGrafanaCacheproperty prevents returning cached responses for resources users don’t have access to.
apiVersion: 1

datasources:
  - name: Azure Monitor
    type: grafana-azure-monitor-datasource
    access: proxy
    jsonData:
      azureAuthType: currentuser
      oauthPassThru: true
      disableGrafanaCache: true
      subscriptionId: <subscription-id> # Optional, default subscription
    version: 1
Additional configuration options
These settings apply to all authentication methods.
General settings
Enable Basic Logs
Toggle Enable Basic Logs to allow queries against Basic Logs tables in supported Log Analytics Workspaces.
Note
Querying Basic Logs tables incurs additional costs on a per-query basis.
Private data source connect (Grafana Cloud only)
If you’re using Grafana Cloud and need to connect to Azure resources in a private network, use Private Data Source Connect (PDC).
- Click the Private data source connect dropdown to select your PDC configuration.
- Click Manage private data source connect to view your PDC connection details.
For more information, refer to Private data source connect and Configure PDC.
Supported cloud names
When provisioning the data source, use the following cloudName values:
Note
For Current User authentication, the cloud names differ: use
AzureCloudfor public cloud,AzureChinaCloudfor the Chinese national cloud, andAzureUSGovernmentfor the US Government cloud.
Verify the connection
After configuring the data source, click Save & test. A successful connection displays a message confirming that the credentials are valid and have access to the configured default subscription.
If the test fails, verify:
- Your credentials are correct (tenant ID, client ID, and client secret or certificate fields)
- The identity has the required Azure RBAC permissions
- For Managed Identity or Workload Identity, that the Grafana server configuration is correct
- Network connectivity to Azure endpoints
Provision the data source
You can define and configure the Azure Monitor data source in YAML files as part of the Grafana provisioning system. For more information about provisioning, refer to Provisioning Grafana.
Provision quick reference
All methods support the optional subscriptionId field to set a default subscription.
For complete YAML examples, see the authentication method sections above.
Configure with Terraform
You can configure the Azure Monitor data source using the Grafana Terraform provider. This approach enables infrastructure-as-code workflows and version control for your Grafana configuration.
Terraform prerequisites
- Terraform installed
- Grafana Terraform provider configured with appropriate credentials
- For Grafana Cloud: A Cloud Access Policy token with data source permissions
Provider configuration
Configure the Grafana provider to connect to your Grafana instance:
terraform {
  required_providers {
    grafana = {
      source  = "grafana/grafana"
      version = ">= 2.0.0"
    }
  }
}

# For Grafana Cloud
provider "grafana" {
  url  = "<YOUR_GRAFANA_CLOUD_STACK_URL>"
  auth = "<YOUR_SERVICE_ACCOUNT_TOKEN>"
}

# For self-hosted Grafana
# provider "grafana" {
#   url  = "http://localhost:3000"
#   auth = "<API_KEY_OR_SERVICE_ACCOUNT_TOKEN>"
# }
Terraform examples
The following examples show how to configure the Azure Monitor data source for each authentication method.
App Registration (client secret):
resource "grafana_data_source" "azure_monitor" {
  type = "grafana-azure-monitor-datasource"
  name = "Azure Monitor"

  json_data_encoded = jsonencode({
    azureAuthType  = "clientsecret"
    cloudName      = "azuremonitor"
    tenantId       = "<TENANT_ID>"
    clientId       = "<CLIENT_ID>"
    subscriptionId = "<SUBSCRIPTION_ID>"
  })

  secure_json_data_encoded = jsonencode({
    clientSecret = "<CLIENT_SECRET>"
  })
}
App Registration (client certificate with PEM):
resource "grafana_data_source" "azure_monitor" {
  type = "grafana-azure-monitor-datasource"
  name = "Azure Monitor"

  json_data_encoded = jsonencode({
    azureAuthType     = "clientcertificate"
    cloudName         = "azuremonitor"
    tenantId          = "<TENANT_ID>"
    clientId          = "<CLIENT_ID>"
    certificateFormat = "pem"
    subscriptionId    = "<SUBSCRIPTION_ID>"
  })

  secure_json_data_encoded = jsonencode({
    clientCertificate = "<CERTIFICATE_CONTENT>"
    privateKey        = "<PRIVATE_KEY_CONTENT>"
  })
}
App Registration (client certificate with PFX):
resource "grafana_data_source" "azure_monitor" {
  type = "grafana-azure-monitor-datasource"
  name = "Azure Monitor"

  json_data_encoded = jsonencode({
    azureAuthType     = "clientcertificate"
    cloudName         = "azuremonitor"
    tenantId          = "<TENANT_ID>"
    clientId          = "<CLIENT_ID>"
    certificateFormat = "pfx"
    subscriptionId    = "<SUBSCRIPTION_ID>"
  })

  secure_json_data_encoded = jsonencode({
    clientCertificate = "<CERTIFICATE_CONTENT_BASE64_ENCODED>"
    certificatePassword = "<CERTIFICATE_PASSWORD>"
  })
}
Managed Identity:
resource "grafana_data_source" "azure_monitor" {
  type = "grafana-azure-monitor-datasource"
  name = "Azure Monitor"

  json_data_encoded = jsonencode({
    azureAuthType  = "msi"
    subscriptionId = "<SUBSCRIPTION_ID>"
  })
}
Workload Identity:
resource "grafana_data_source" "azure_monitor" {
  type = "grafana-azure-monitor-datasource"
  name = "Azure Monitor"

  json_data_encoded = jsonencode({
    azureAuthType  = "workloadidentity"
    subscriptionId = "<SUBSCRIPTION_ID>"
  })
}
Current User:
resource "grafana_data_source" "azure_monitor" {
  type = "grafana-azure-monitor-datasource"
  name = "Azure Monitor"

  json_data_encoded = jsonencode({
    azureAuthType       = "currentuser"
    oauthPassThru       = true
    disableGrafanaCache = true
    subscriptionId      = "<SUBSCRIPTION_ID>"
  })
}
With Basic Logs enabled:
Add enableBasicLogs = true to any of the above configurations:
resource "grafana_data_source" "azure_monitor" {
  type = "grafana-azure-monitor-datasource"
  name = "Azure Monitor"

  json_data_encoded = jsonencode({
    azureAuthType   = "clientsecret"
    cloudName       = "azuremonitor"
    tenantId        = "<TENANT_ID>"
    clientId        = "<CLIENT_ID>"
    subscriptionId  = "<SUBSCRIPTION_ID>"
    enableBasicLogs = true
  })

  secure_json_data_encoded = jsonencode({
    clientSecret = "<CLIENT_SECRET>"
  })
}
For more information about the Grafana Terraform provider, refer to the provider documentation and the grafana_data_source resource.


