This is documentation for the next version of Grafana documentation. For the latest stable release, go to the latest version.
Configure Grafana IRM for Alerting
In Grafana OSS and Grafana Enterprise, you can use a webhook contact point to send alerts to Grafana IRM. Grafana IRM can then route alerts based on escalation chains for your team’s workflows.
The alert notification flow is as follows:
* Grafana OSS/Enterprise (send webhook alerts)->Grafana Cloud IRM (route via escalation chains)
Note
The Free Forever plan in Grafana Cloud IRM includes 3 IRM active users per month.
These instructions apply only to Grafana OSS and Grafana Enterprise. To configure IRM for Grafana Cloud Alerting, refer to the Grafana Cloud documentation.
Configure an integration in Grafana IRM
First, enable an integration in IRM to accept alerts from Grafana Alerting. You can either create a new integration or use an existing Alertmanager or Webhook integration in IRM.
To create the integration, follow the same steps as described in Configure an OnCall integration in IRM:
Navigate to Alerts & IRM -> IRM -> Integrations.
Click + New integration.
Select either Alertmanager or Webhook integration from the list.
Alertmanager integration – Includes preconfigured IRM templates for processing Grafana and Prometheus alerts.
Webhook integration – Uses default IRM templates for general alert processing.
Provide a title, description, and assign it to a team, then click Create Integration.
On the integration details page, copy the HTTP Endpoint URL to use in the next section.
Configure a webhook contact point in Grafana Alerting
Next, configure the contact point in Grafana Alerting to send alert notifications to Grafana IRM.
In Grafana OSS and Grafana Enterprise, you need to create a Webhook contact point using the HTTP endpoint URL you copied in the previous step.
- Navigate to Alerts & IRM -> Alerting -> Notification configuration, then select the Contact points tab.
- Click + Add contact point.
- Enter a name for the contact point.
- From the Integration list, select Webhook.
- In the URL field, enter the HTTP endpoint URL of the IRM integration.
- Click Save contact point.
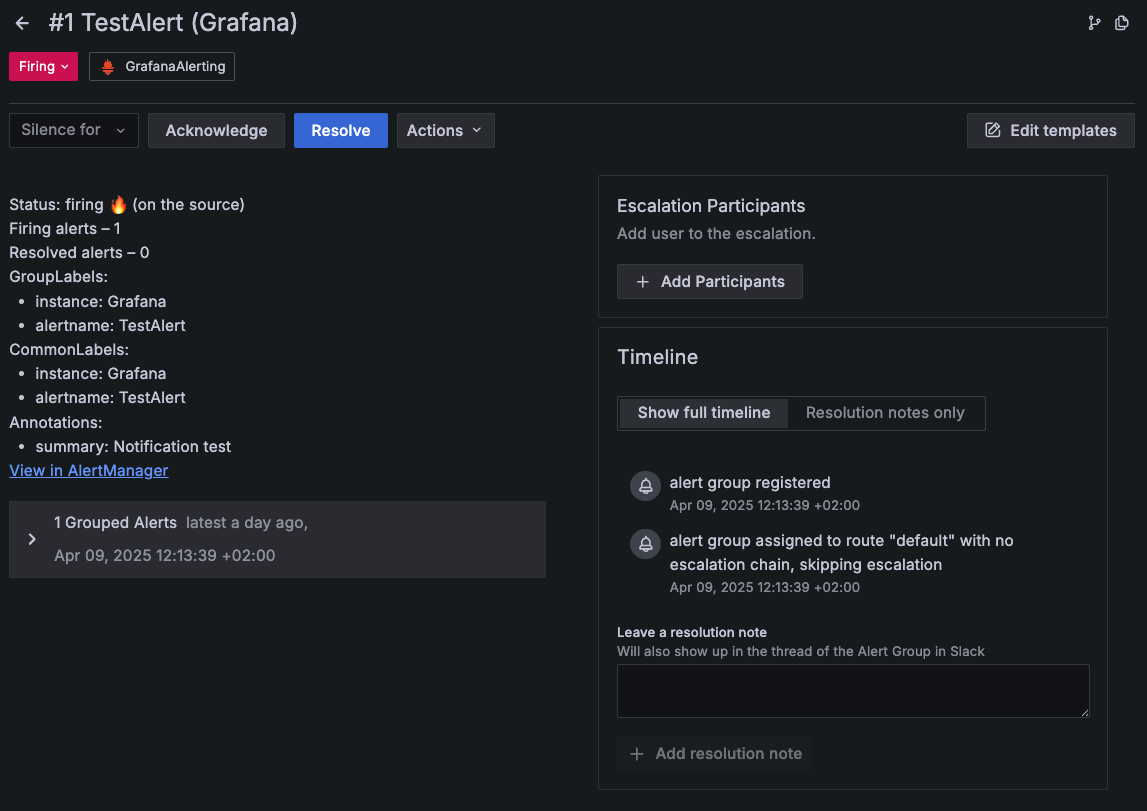
After configuring the contact point in Grafana Alerting and the integration in Grafana IRM, you can start testing the Alerting-to-IRM integration.

For more information, see:
- Configure contact points – Learn how to test the integration and enable notifications in Alerting.
- Webhook contact point – Learn the format of the webhook payload and additional settings in Alerting.
- Configure IRM alert templates – Learn how to process the incoming webhook messages in IRM.
Enable heartbeat monitoring in Grafana IRM (optional)
Enabling the heartbeat in the IRM integration acts as a monitoring for your Grafana Alerting setup. If Grafana Alerting stops sending alerts—due to downtime or misconfiguration—Grafana IRM creates a new alert group to notify you.
To set up heartbeat monitoring, you must enable the heartbeat in IRM and create an alert rule that continuously sends alerts to the heartbeat endpoint.
Enable the heartbeat for the IRM integration
- In IRM, select the IRM integration you configured earlier.
- Click the ⋮ (three dots) on top right, then select Heartbeat Settings.
- Copy the Endpoint URL—this will be used in a new contact point in Grafana Alerting.
- Set the heartbeat interval, time period after which Grafana IRM starts a new alert group if it doesn’t receive a heartbeat.
Create another Webhook contact point in Grafana Alerting
Follow the same steps as before to create a webhook contact point in Grafana Alerting:
- Navigate to Alerts & IRM -> Alerting -> Notification configuration, then select the Contact points tab.
- Click + Add contact point.
- Enter a name for the contact point.
- From the Integration list, select Webhook.
- In the URL field, enter the endpoint URL of the heartbeat.
- Click Save contact point.
You can now click the Test button to send an alert to the heartbeat endpoint. In IRM, verify the heartbeat status in the Hearbeat column on the Integrations page.

Create an alert rule in Grafana Alerting
Create a Grafana-managed alert rule with the following settings:
- Always firing – Use a query and alert condition that constantly fire. For example, select a Prometheus data source and set the query to
vector(1) > 0. - Configure a pending period that is shorter than the hearbeat interval.
- Choose the webhook contact point you created for the heartbeat to forward alerts.
- Adjust
timing options in the alert rule or notification policy to ensure alerts are forwarded before the heartbeat interval elapses:
- Group wait:
0s - Group interval:
1s - Repeat interval: shorter than the hearbeat interval.
- Group wait:
After it’s created, the alert rule acts as a heartbeat, verifying that Grafana Alerting is running and sending alerts to Grafana IRM.


