
This is documentation for the next version of Grafana documentation. For the latest stable release, go to the latest version.
Examples of trace-based alerts
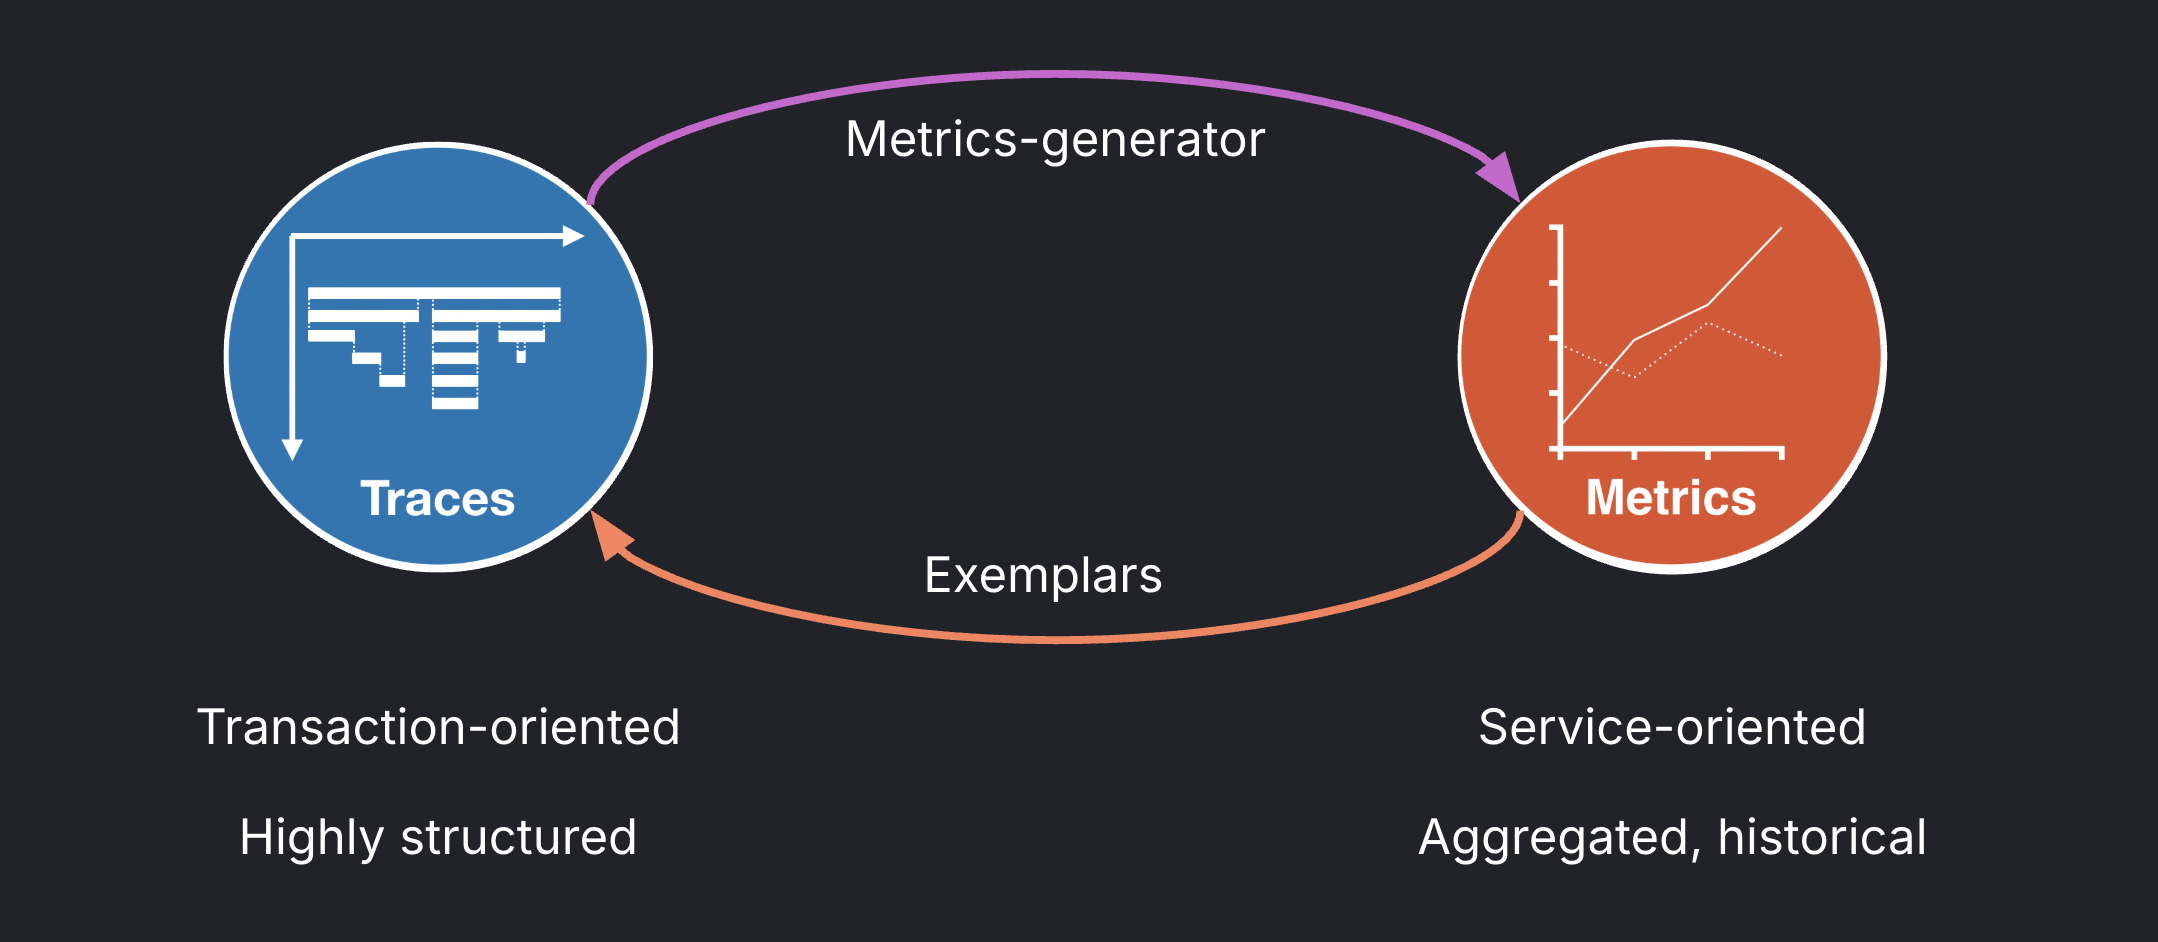
Metrics are the foundation of most alerting systems. They are usually the first signal that something is wrong, but they don’t always indicate where or why a failure occurs.
Traces fill that gap by showing the complete path a request takes through your system. They map the workflows across services, indicating where the request slows down or fails.
Traces report duration and errors directly to specific services and spans, helping to find the affected component and service scope. With this additional context, alerting on tracing data can help you identify root causes faster.
You can create trace-based alerts in Grafana Alerting using two main approaches:
- Querying metrics generated from tracing data.
- Using TraceQL, a query language for traces available in Grafana Tempo.
This guide provides introductory examples and distinct approaches for setting up trace-based alerts in Grafana. Tracing data is commonly collected using OpenTelemetry (OTel) instrumentation. OTel allows you to integrate trace data from a wide range of applications and environments into Grafana.
Alerting on span metrics
OpenTelemetry provides processors that convert tracing data into Prometheus-style metrics.
The service graph and span metrics processors are the standard options in Alloy and Tempo to generate Prometheus metrics from traces. They can generate the rate, error, and duration (RED) metrics from sampled spans.
You can then create alert rules that query metrics derived from traces.
Service graph metrics focus on inter-service communication and dependency health. They measure the calls between services, helping Grafana to infer the service topology. However, they measure only the interaction between two services—they don’t include the internal processing time of the client service.
You can use service graph metrics to detect infrastructure issues such as network degradation or service mesh problems.
For trace-based alerts, we recommend using span metrics.
Span metrics measure the total processing time of a service request: capturing what happens inside the service, not just the communication between services. They include the time spent on internal processing and waiting on downstream calls, providing an end-to-end picture of service performance.
Depending on how you create span metrics, the following span metrics are generated:
Each metric includes by default the following labels: service, span_name, span_kind, status_code, status_message, job, and instance.
In the metrics generator, you can customize how traces are converted into metrics by configuring histograms, exemplars, metric dimensions, and other options.
The following examples assume that span metrics have already been generated using one of these options or an alternative.
Detect slow span operations
This example shows how to define an alert rule that detects when operations handled by a service become slow.
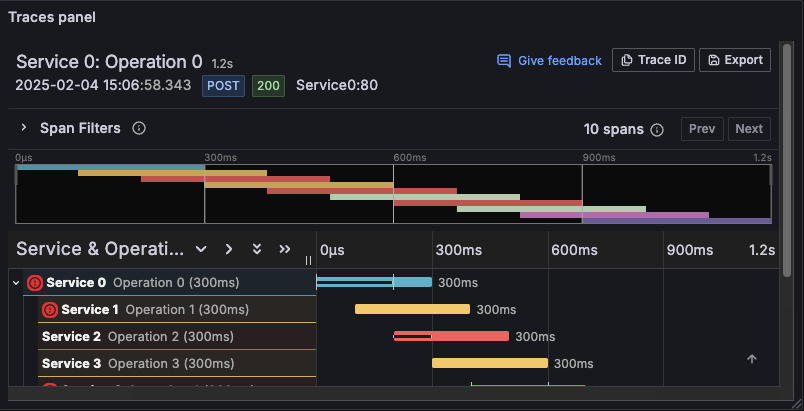
Before looking at the query, it’s useful to review a few trace elements that shape how it works:
- A trace represents a single request or transaction as it flows through multiple spans and services. A span refers to a specific operation within a service.
- Each span includes the operation name (
span_name) and its duration (the metric value), as well as additional fields like span status (status_code) and span kind (span_kind). - A server span represents work performed on the receiving side of a request, while a client span represents the outbound call (parent span) waiting for a response (client → server).
To detect slow inbound operations within a specific service, you can define an alert rule that detects when the percentile latency of server spans exceeds a threshold. For example:
Detect when 95% of requests (excluding errors) do not complete faster than 2 seconds.
Using native histograms
The following PromQL query uses the traces_span_metrics_duration_seconds native histogram metric to define the alert rule query.
histogram_quantile(0.95,
 sum by (span_name) (
   rate(traces_span_metrics_duration_seconds{
     service_name="<SERVICE_NAME>",
     span_kind="SPAN_KIND_SERVER",
     status_code!="STATUS_CODE_ERROR"
   }[10m])
 )
) > 2
Here’s the query breakdown:
traces_span_metrics_duration_secondsIt’s a native histogram produced from spans using Alloy or the OTEL collector. The metric is filtered by:service_name="<SERVICE_NAME>"targets a particular service.span_kind="SPAN_KIND_SERVER"selects spans handling inbound requests.status_code!="STATUS_CODE_ERROR"excludes spans that ended with errors.
You should query
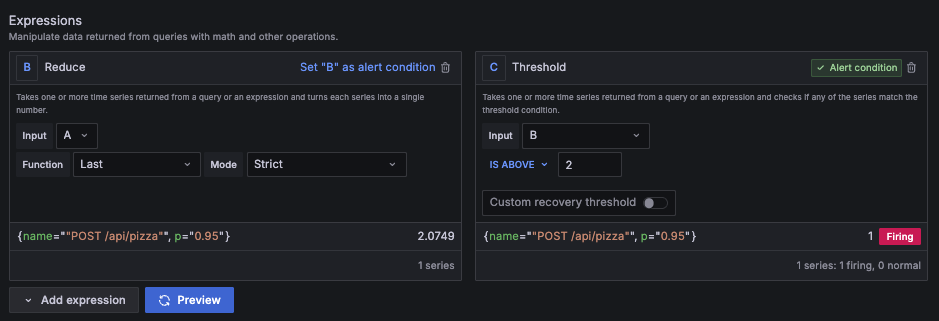
traces_spanmetrics_latencywhen using other span metric generators.rate(...[10m])Converts the histogram into a per-second histogram over the last 10 minutes (the distribution of spans per second during that period). This makes the time window explicit and ensures latencies can be calculated over the last 10 minutes usinghistogram_*functions.sum by (span_name)( … )Merges all series that share the samespan_name. This creates a multidimensional alert that generates one alert instance per span name (operation).histogram_quantile(0.95, ...)Calculates p95 latency from the histogram after applying the rate. The query runs as an instant Prometheus query, returning a single value for the 10-minute window.> 2Defines the threshold condition. It returns only series whose p95 latency exceeds 2 seconds. Alternatively, you can set this threshold as a Grafana Alerting expression in the UI, as shown in the following screenshot.
Alert rule querying span metrics and using threshold expression

Using classic histograms
Native histograms are stable in Prometheus since v3.8.0. Your span metric generator may therefore create classic histograms for latency span metrics, either traces_span_metrics_duration_seconds or traces_spanmetrics_latency.
When using classic histograms, the metric is the same but the metric format changes. A classic histogram represents a histogram with fixed buckets and exposes three metrics:
_bucket: cumulative buckets of the observations._sum: total sum of all observed values._count: count of observed values.
To calculate percentiles accurately, especially exceeding a particular threshold (e.g. `2s`), you have to configure the classic histogram with the explicit bucket, such as:
["100ms", "250ms", "1s", "2s", "5s"]The otelcol.connector.spanmetrics can configure the buckets using the explicit block. The metric-generator in Tempo can configure the span_metrics.histogram_buckets setting.
Here’s the equivalent PromQL for classic histograms:
histogram_quantile(0.95,
 sum by (span_name, le) (
   rate(traces_span_metrics_duration_seconds_bucket{
     service_name="<SERVICE_NAME>",
     span_kind="SPAN_KIND_SERVER",
     status_code!="STATUS_CODE_ERROR"
   }[10m])
 )
) > 2
Key differences compared with the native histograms example:
- You must configure a histogram bucket matching the desired threshold (for example,
2s). - You must query the
_bucketmetric, not the base metric. - You must include
lein thesum by (…)grouping forhistogram_quantilecalculation.
Everything else remains the same.
Note
The alert rules in these examples create multi-dimensional alerts: one alert instance for each distinct span name.
Dynamic span routes such as
/product/1234can create separate metric dimensions and alerts for each unique span, which can significantly impact metric costs and performance for large volumes.To prevent high-cardinality data, normalize dynamic routes like
/product/{id}using semantic attributes such ashttp.routeandurl.template, and limit dimensions to low-cardinality fields such asservice_name,status_code, orhttp_method.
Detect high error rate
This example defines an alert rule that detects when the error rate for any operation exceeds 20%. You can use this error rate alerts to identify increases in request errors, such as 5xx responses or internal failures.
The following query calculates the fraction of failed server spans for each service and operation.
(
  sum by (service, span_name) (
    rate(traces_span_metrics_calls_total{
      span_kind="SPAN_KIND_SERVER",
      status_code="STATUS_CODE_ERROR"
    }[10m])
  )
/
  sum by (service, span_name) (
    rate(traces_span_metrics_calls_total{
      span_kind="SPAN_KIND_SERVER"
    }[10m])
  )
) > 0.2
Here’s the query breakdown
traces_span_metrics_calls_totalA counter metric produced from spans that tracks the number of completed span operations.span_kind="SPAN_KIND_SERVER"selects spans handling inbound requests.status_code="STATUS_CODE_ERROR"selects only spans that ended in error.- Omitting the
status_codefilter in the denominator includes all spans, returning the total span count.
Check whether your metric generator instead creates the
traces_spanmetrics_calls_totalmetric, and adjust the metric name.rate(...[10m])Converts the cumulative histogram into a per-second histogram over the last 10 minutes (the distribution of spans per second during that period). This makes the time window explicit and ensures counters can be calculated over the last 10 minutes.sum by (service, span_name)( … )Aggregates per service and operation, creating one alert instance for each(service, span_name)combination. This is a multidimensional alert that applies to all services, helping identify which service and corresponding operation is failing.sum by () (...) / sum by () (...)Divides failed spans by total spans to calculate the error rate per operation. The result is a ratio between0and1,where1means all operations failed. The query runs as an instant Prometheus query, returning a single value for the 10-minute window.> 0.2Defines the threshold condition. It returns only series whose error rate is higher than 20% of spans. Alternatively, you can set this threshold as a Grafana Alerting expression in the UI.
Enable traffic guardrails
When the traffic is very low, even a single slow or failing request can trigger the alerts.
To avoid these types of false positives during low-traffic periods, you can include a minimum traffic condition in your alert rule queries. For example:
sum by (service, span_name)(
  increase(traces_span_metrics_calls_total{
    span_kind="SPAN_KIND_SERVER"
  }[10m])
) > 300
This query returns only spans that handled more than 300 requests in the 10-minute period.
This minimum level of traffic helps prevent false positives, ensuring the alert evaluates a significant number of spans before triggering.
You can combine this traffic condition with the error-rate query to ensure alerts fire only when both conditions are met:
((
  sum by (service, span_name) (
    rate(traces_span_metrics_calls_total{
      span_kind="SPAN_KIND_SERVER",
      status_code="STATUS_CODE_ERROR"
    }[10m])
  )
/
  sum by (service, span_name) (
    rate(traces_span_metrics_calls_total{
      span_kind="SPAN_KIND_SERVER"
    }[10m])
  )
) > 0.2)
and
(
    sum by (service, span_name)(
    increase(traces_span_metrics_calls_total{
      span_kind="SPAN_KIND_SERVER"
    }[10m])
) > 300 )
For a given span, the alert fires when:
- The error rate exceeds 20% over the last 10 minutes.
- The span handled at least 300 requests over the last 10 minutes.
Alternatively, you can split the alert into separate queries and combine them using a math expression as the threshold. In the example below, $ErrorRateCondition is the Grafana reference for the error-rate query, and $TrafficCondition is the reference for the traffic query.
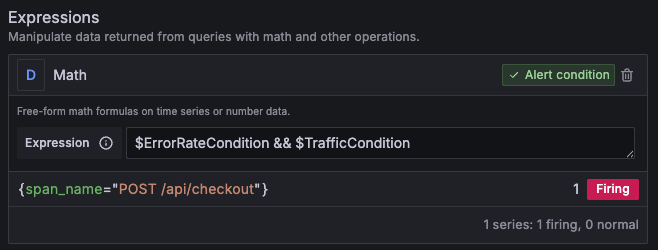
In this case, you must ensure both queries group by the same labels.
The advantage of this approach is that you can observe the results of both independent queries. You can then access the query results through the $values variable and display them in notifications or use them in custom labels.
A potential drawback of splitting queries is that each query runs separately. This increases backend load and can affect query performance, especially in environments with a large number of active alerts.
You can apply this traffic guardrail pattern to any alert rule.
Consider sampling
Sampling is a technique used to reduce the amount of collected spans for cost-saving purposes. There are two main strategies which can be combined:
- Head sampling: The decision to record or drop a span is made when the trace begins. The condition can be configured probabilistically (a percentage of traces) or by filtering out certain operations.
- Tail sampling: The decision is made after the trace completes. This allows sampling more interesting operations, such as slow or failing requests.
With head sampling, alerting on span metrics should be done with caution, since span metrics will represent only a subset of all traces.
With tail sampling, it’s important to generate span metrics before a sampling decision is made. Grafana Cloud Adaptive Traces handle this automatically. With Alloy or the OpenTelemetry Collector, make sure the SpanMetrics connector runs before the filtering or tail sampling processor.
Using TraceQL
TraceQL is a query language for searching and filtering traces in Grafana Tempo, which uses a syntax similar to PromQL and LogQL.
With TraceQL, you can skip converting tracing data into span metrics and query raw trace data directly. It provides a more flexible filtering based on the trace structure, attributes, or resource metadata, and can detect issues faster as it does not wait for metric generation.
TraceQL isn’t suitable for all scenarios. For example:
Inadequate for long-term analysis Trace data has a significantly shorter retention period than metrics. For historical monitoring, it’s recommended to convert key tracing data into metrics to ensure the persistence of important data.
Inadequate for alerting after sampling TraceQL can only query traces that are actually stored in Tempo. If sampling drops a large portion of traces, TraceQL-based alerts may miss real issues. Refer to consider sampling for guidance on how to generate span metrics before sampling.
Caution
TraceQL alerting is available in Grafana v12.1 or higher, supported as an experimental feature. Engineering and on-call support isn’t available. Documentation is either limited or not provided outside of code comments. No SLA is provided.
While TraceQL can be powerful for exploring and detecting issues directly from trace data, alerting with TraceQL shouldn’t be used in production environments yet. Use it for testing and experimentation at this moment.
The following example demonstrates how to recreate the previous alert rule that detected slow span operations using TraceQL.
Follow these steps to create the alert:
Enable TraceQL alerting To use TraceQL in alerts, you must enable the
tempoAlertingfeature flag in your Grafana configuration.If you use Grafana Cloud, contact Support to enable TraceQL alerting.
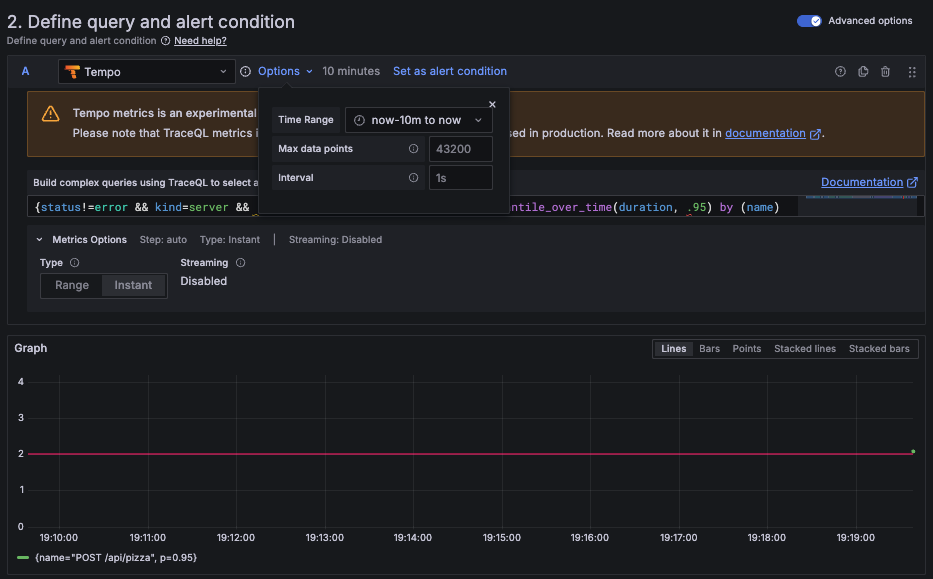
Configure the alert query
In your alert rule, select the Tempo data source, then convert the original PromQL query into the equivalent TraceQL query:
{status != error && kind = server && .service.name = "<SERVICE_NAME>"}
| quantile_over_time(duration, .95) by (name)
For a given service, this query calculates the p95 latency for all server spans, excluding errors, and groups them by span name.
Configure the time range
Currently, TraceQL alerting supports only range queries. To define the time window, set the query time range to the last 10 minutes.
From:
now-10mTo:
now![Time range configuration for TraceQL alert rule]()
Add a reducer expression.
Range queries return time series data, not a single value. The alert rule must then reduce time series data to a single numeric value before comparing it against a threshold.
Add a Reduce expression to convert the query results into a single value.
Set the threshold condition.
Create a Threshold expression to fire when the p95 latency exceeds 2 seconds: $B > 2.
![Alert rule configuration showing reducer and threshold expressions for TraceQL query]()
This final alert detects when 95% of the server spans for a particular service (excluding errors) take longer than 2 seconds to complete, using raw trace data instead of span metrics.
Additional resources
To explore related topics and expand the examples in this guide, see the following resources:
Trace structure: Learn how traces and spans are structured.
Grafana Tempo documentation: Full reference for Grafana’s open source tracing backend.
Span metrics using the metrics generator in Tempo: Generate span metrics directly from traces with Tempo’s built-in metrics generator.
Span metrics using Grafana Alloy: Configure Alloy to export span metrics from OpenTelemetry (OTel) traces.
Multi-dimensional alerts: Learn how to trigger multiple alert instances per alert rule like in these examples.
Grafana SLO documentation: Use span metrics to define Service Level Objectives (SLOs) in Grafana.
Trace sampling: explore strategies and configuration in Grafana Tempo.
Note
OpenTelemetry instrumentations can record metrics independently of spans.
These OTEL metrics are not derived from traces and are not affected by sampling. They can serve as an alternative to span-derived metrics.


