Documentation for automated readers A curated documentation index is available at: https://grafana.com/llms.txt
A complete documentation index is available at: https://grafana.com/llms-full.txt These indexes can help with page discovery before fetching individual documents.
This page is also available in Markdown, which may be easier for automated readers
and AI tools to parse than HTML. The Markdown version is available at
https://grafana.com/docs/grafana/latest/whatsnew/whats-new-in-v12-3.md, or by sending
Accept: text/markdown to https://grafana.com/docs/grafana/latest/whatsnew/whats-new-in-v12-3/. For broader
documentation discovery, the curated index is available at https://grafana.com/llms.txt
and the complete index is available at https://grafana.com/llms-full.txt.
This release reimagines how you explore logs, delivers more ways to connect your data, and enables more intuitive sharing, so you can spend less time navigating tools and more time turning signals into action. It starts with a completely redesigned logs panel that brings faster pattern recognition, clearer context, and a smoother exploration experience. We’ve also expanded what you can do with new data sources and query improvements, from SolarWinds Enterprise to advanced Honeycomb and OpenSearch capabilities.
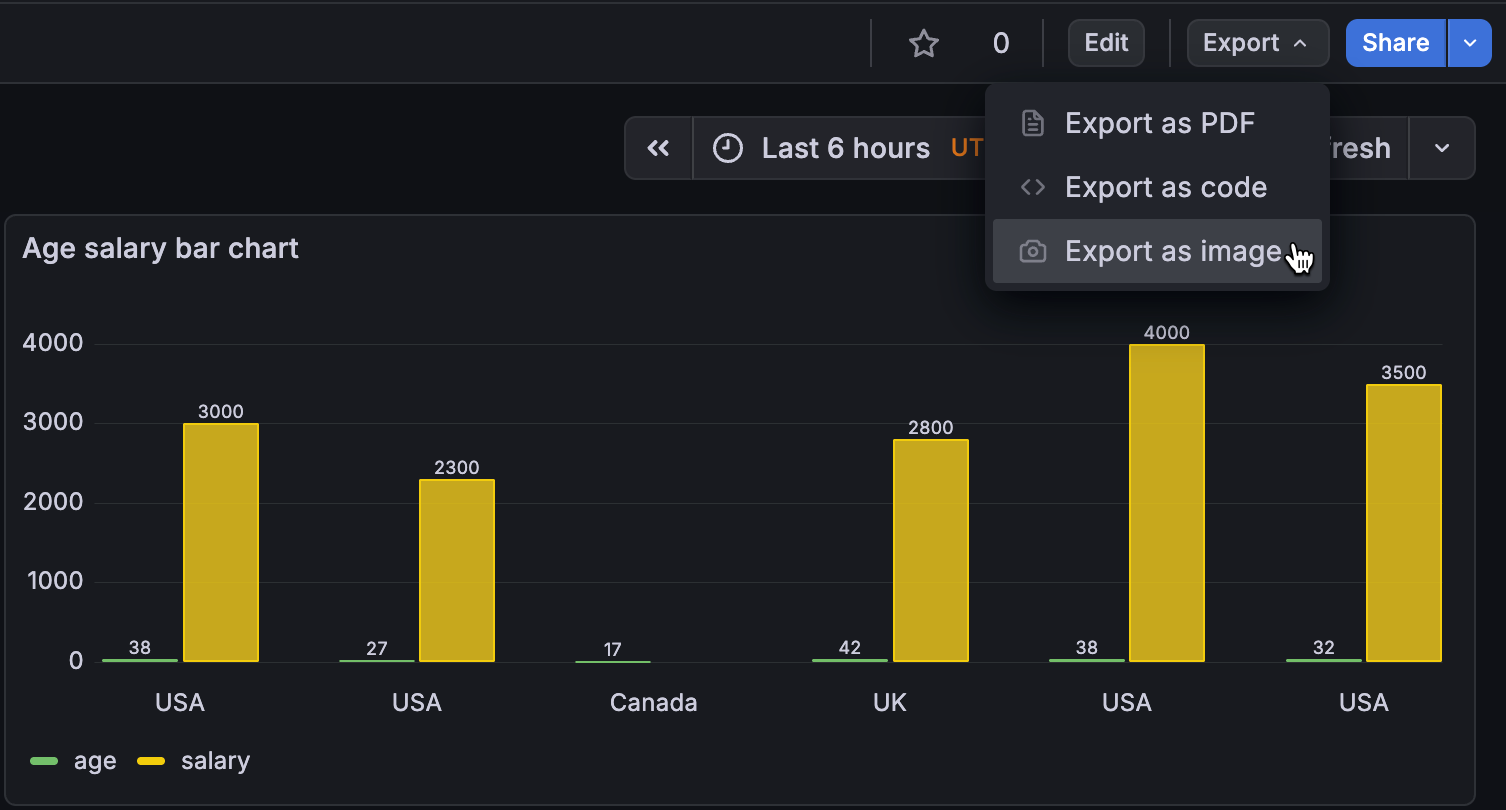
Sharing insights is easier too, with streamlined dashboard image exports and consolidated panel time controls that make comparisons and overrides more intuitive. And to help you learn as you go, a new interactive learning experience now brings contextual guidance directly into Grafana, giving you tips, tutorials, and documentation right when you need them. All of this comes together to make open observability easier, more accessible, and more powerful for every team.
For even more detail about all the changes in this release, refer to the changelog. For the specific steps we recommend when you upgrade to v12.3, check out our
Upgrade Guide.
Grafana CloudAvailable in public previewOpen sourceEnterpriseAvailable in public preview
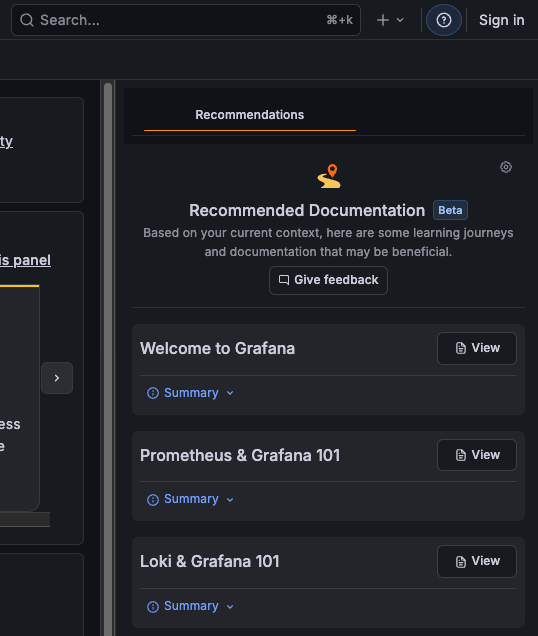
Introducing interactive learning in Grafana
Finding the right documentation at the right time can be tricky, especially when you’re in the middle of working in Grafana. The new interactive learning experience, available in public preview in Grafana 12.3, brings help directly into the product, so you don’t have to leave your workflow to find answers.
Grafana CloudAvailable in public previewOpen sourceEnterpriseAvailable in public preview
Dashboards and visualizations
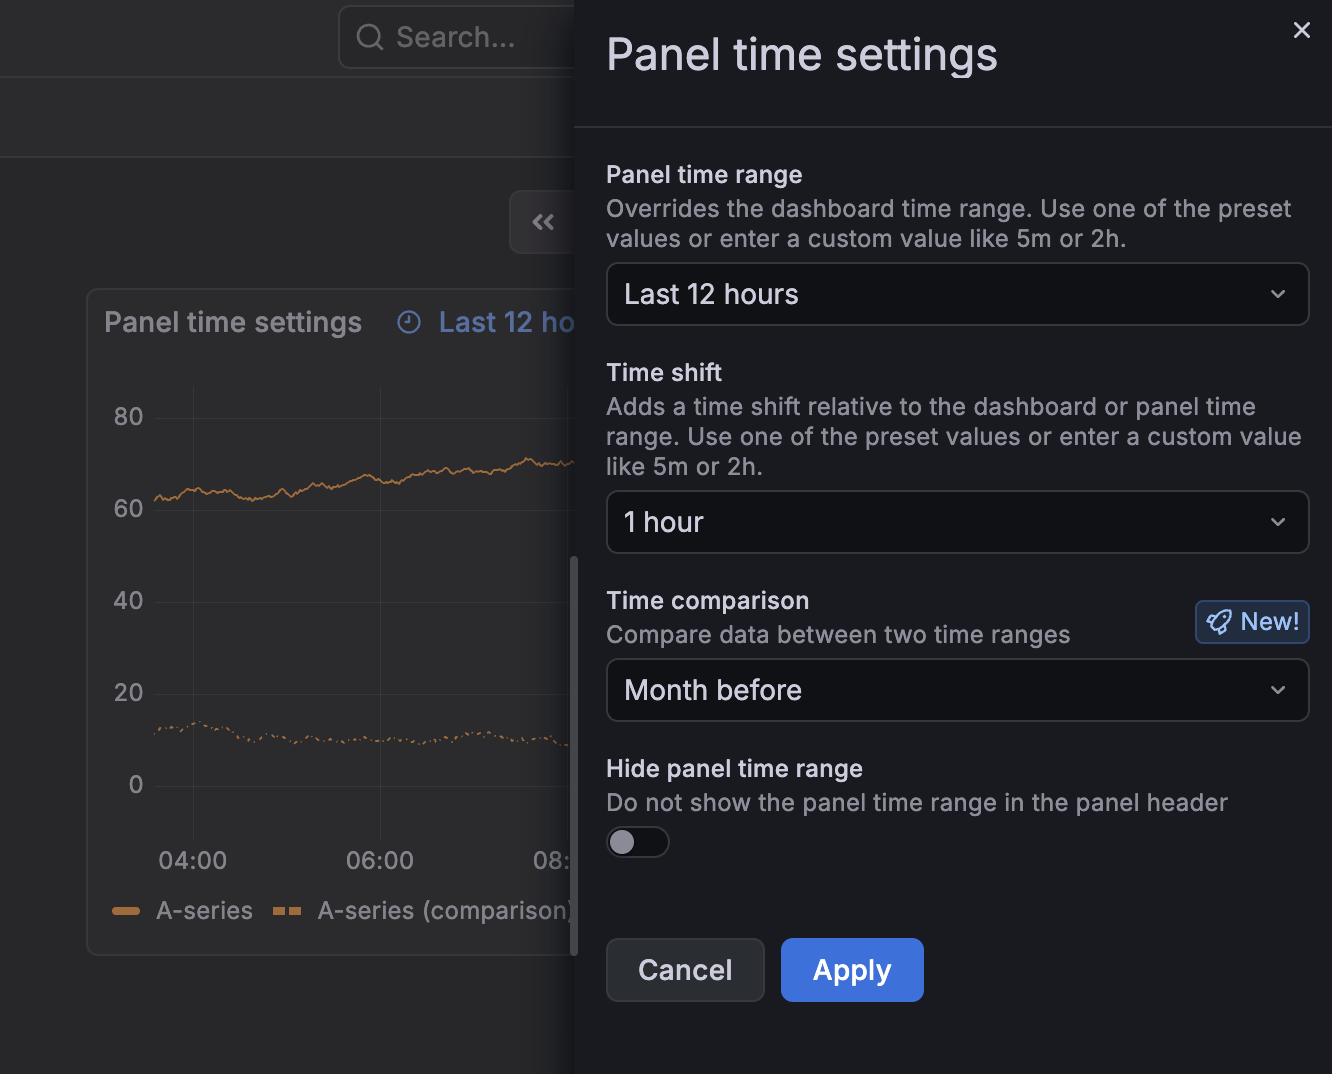
We’re excited to announce the addition of the Panel time settings drawer in visualizations. With this feature, you can access key panel-specific time settings without editing the dashboard:
Grafana CloudGenerally AvailableOpen sourceEnterpriseGenerally Available
Dashboards and visualizations
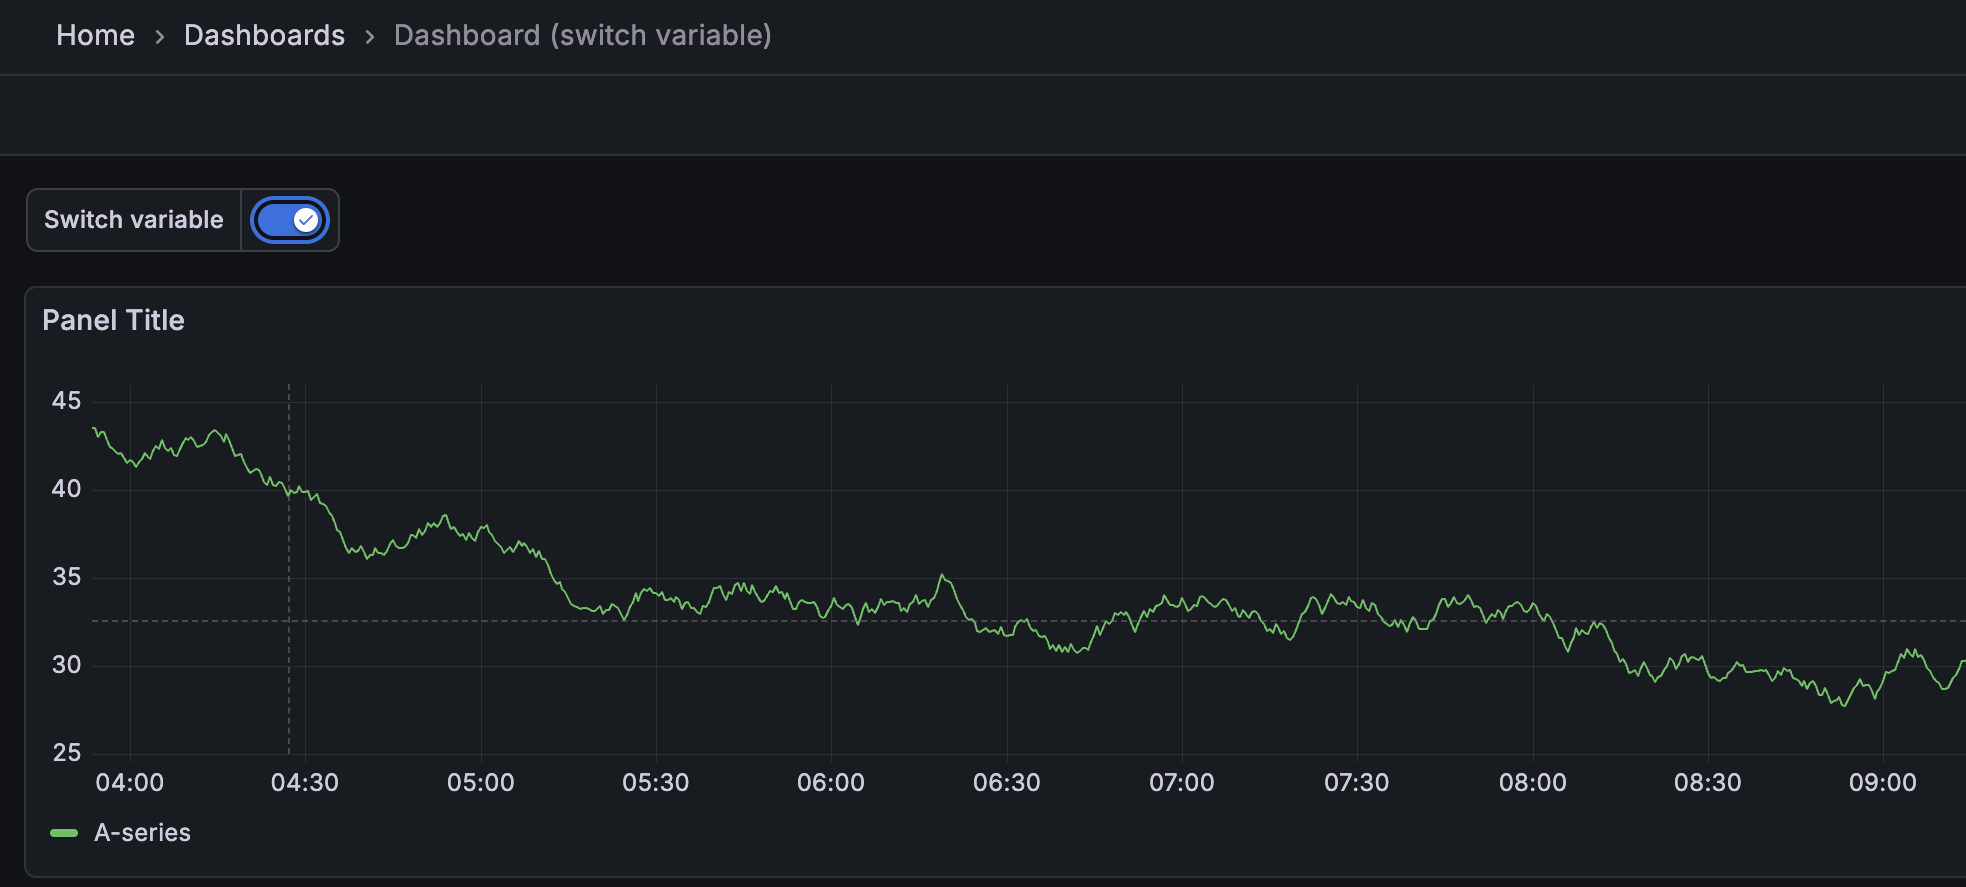
The new Switch template variable type replaces cumbersome drop-down menus with an intuitive toggle interface. Configure any two values—true/false, 1/0, yes/no, or custom pairs—and control boolean states across your dashboard with a single click. Perfect for toggling debug modes, filters, or any conditional logic.
Grafana CloudGenerally AvailableOpen sourceEnterpriseGenerally Available
Dashboards and visualizations
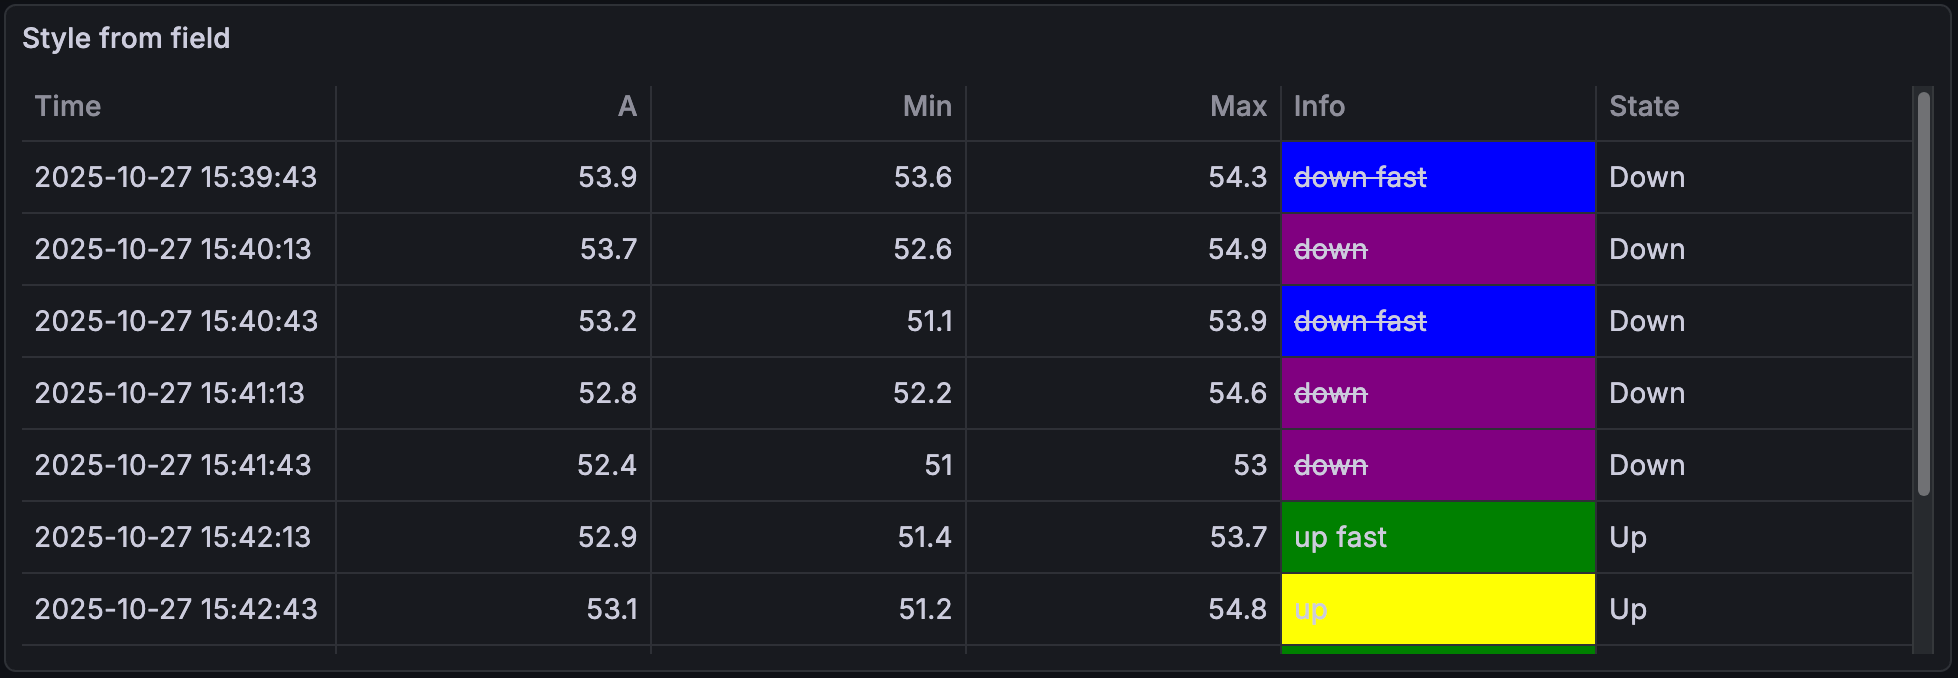
Style table cells with CSS properties with the Styling from field cell option. Using JSON object syntax with CSS properties, you can apply that styling to your table cells.
Grafana CloudAvailable in public previewEnterpriseAvailable in public preview
Dashboards and visualizations
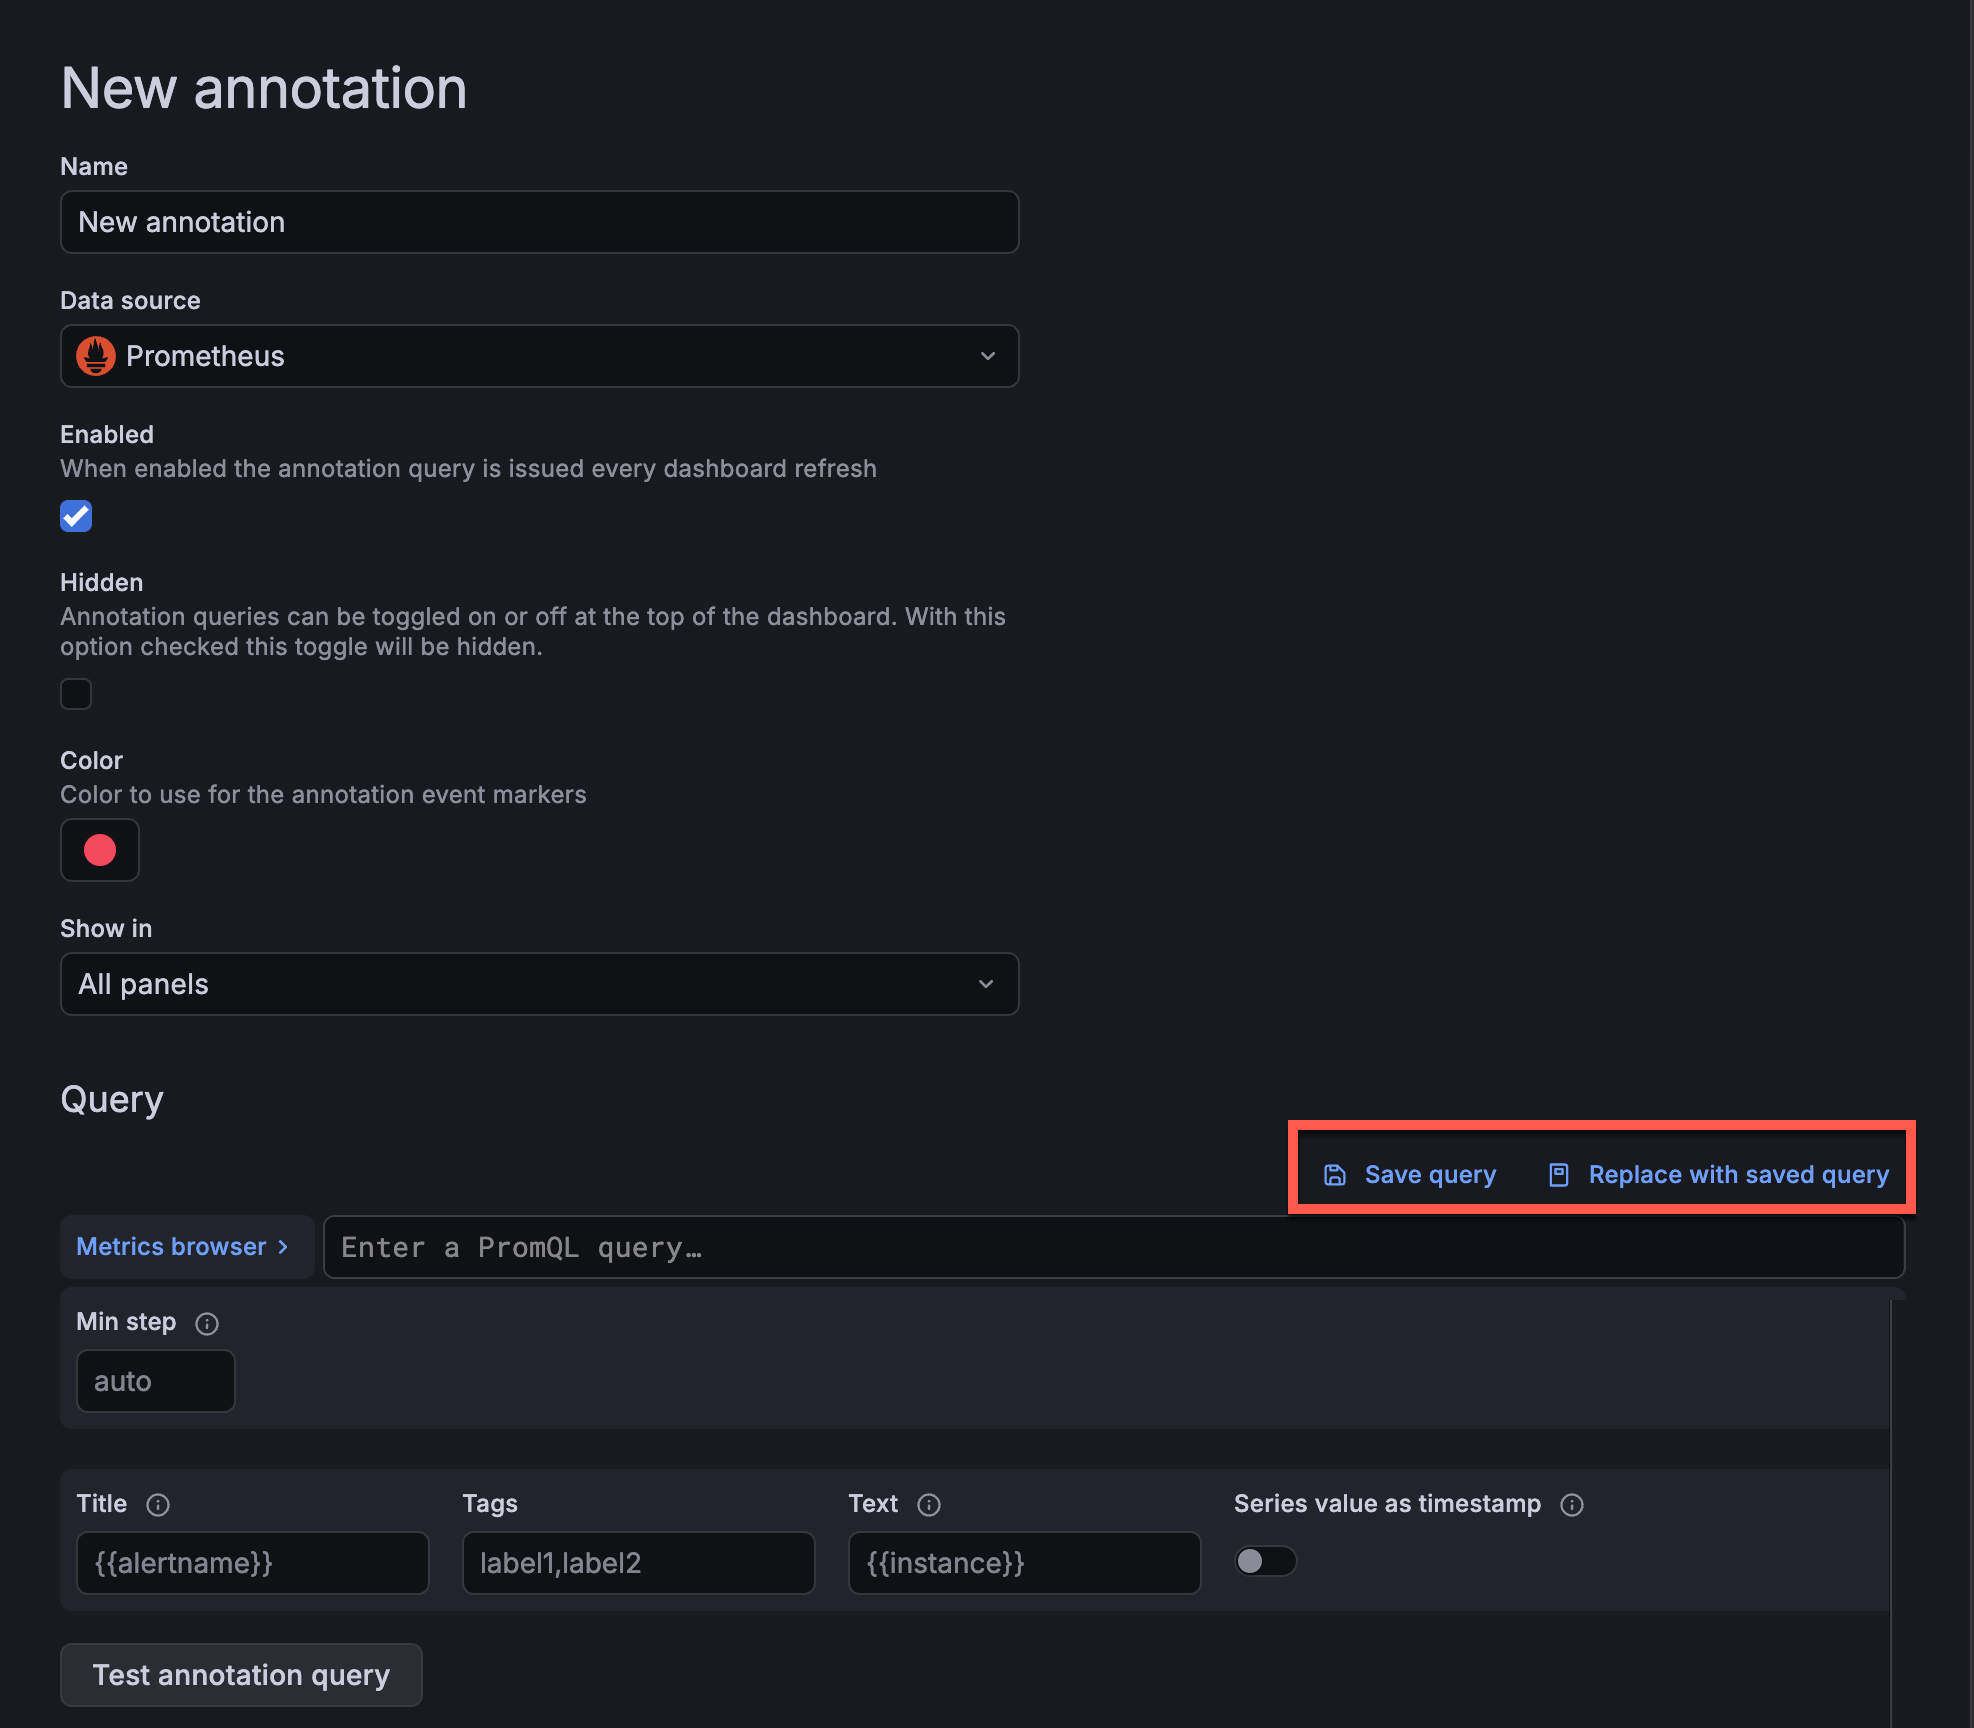
We recently introduced the ability to save queries in Dashboards and Explore—now we’ve extended this functionality to dashboard annotations. With this addition, you can save, reuse, and share annotation queries with others in your organization.
Grafana CloudGenerally AvailableOpen sourceEnterpriseGenerally Available
LogsLogs Drilldown
We are very excited to release a completely redesigned logs visualization!
The logs visualization is one of the core visualizations of Grafana, and we’ve rebuilt it from the ground up to not only address performance issues, but also add many new features and display options to innovate in the space and provide the best possible log browsing experience, such as:
Following up the completely redesigned logs panel, we’ve rebuilt log context around it, improving existing features and enabling new capabilities.
Log context is a feature that displays additional lines of logs surrounding a log entry that matches a specific search query. This helps in understanding the context of the log entry, analog to the -C parameter in the grep command.
Grafana CloudGenerally AvailableOpen sourceEnterpriseGenerally Available
LogsLogs Drilldown
As part of the recently redesigned logs visualization, we’re now adding a new component to interact with fields in log lines, making it easier than ever to toggle fields on and off and customize the display order.
Grafana CloudGenerally AvailableEnterpriseGenerally Available
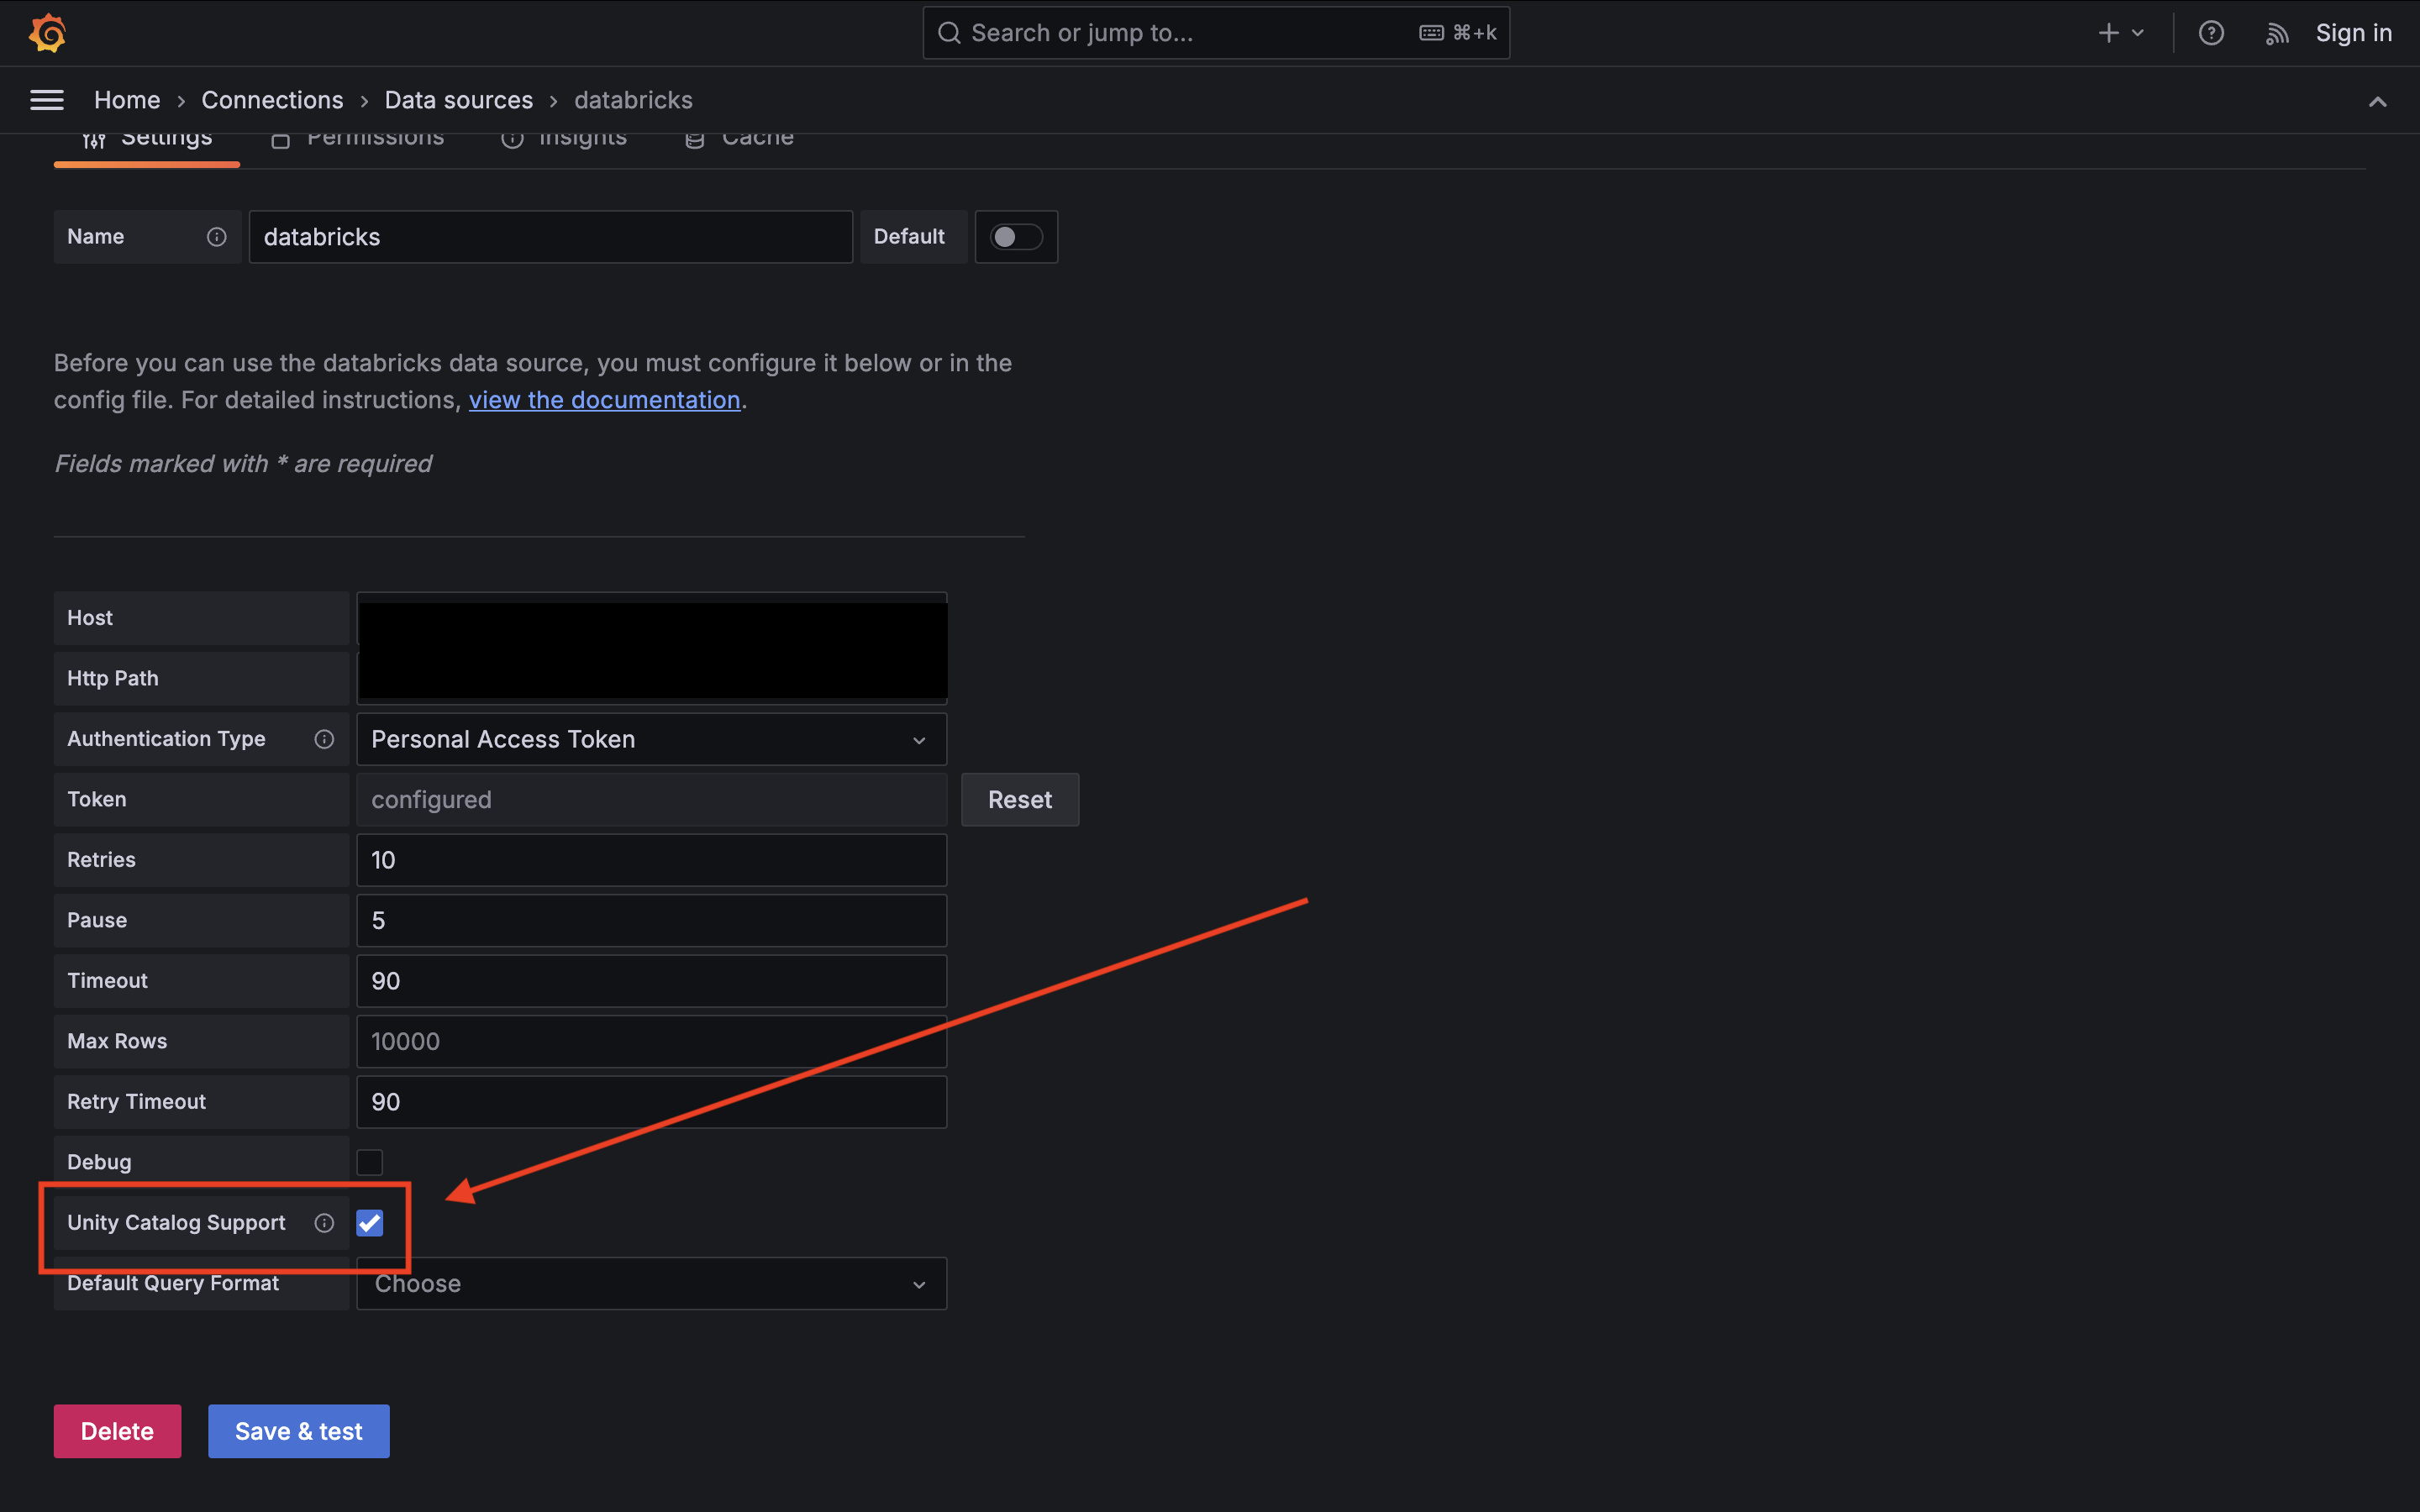
We’ve added support for Databricks Unity Catalog, enabling secure and consistent access to governed data directly within Grafana.
This enhancement allows users to easily query and visualize datasets registered in Unity Catalog while maintaining the same fine-grained permissions and lineage tracking defined in Databricks. With this integration, teams can build dashboards confidently knowing their data follows centralized governance, access control, and compliance standards across all workspaces.
Grafana CloudAvailable in public previewEnterpriseAvailable in public preview
Data sources
We’re excited to announce a powerful new feature for our Honeycomb data source: Raw Query support! This enhancement empowers you to leverage the complete capabilities of the Honeycomb API directly within Grafana, unlocking advanced querying. This feature includes full support for variable substitution and automatic handling of array filters (e.g. with IN and NOT IN operators), making it easier to work with multi-value variables.
Grafana CloudGenerally AvailableOpen sourceEnterpriseGenerally Available
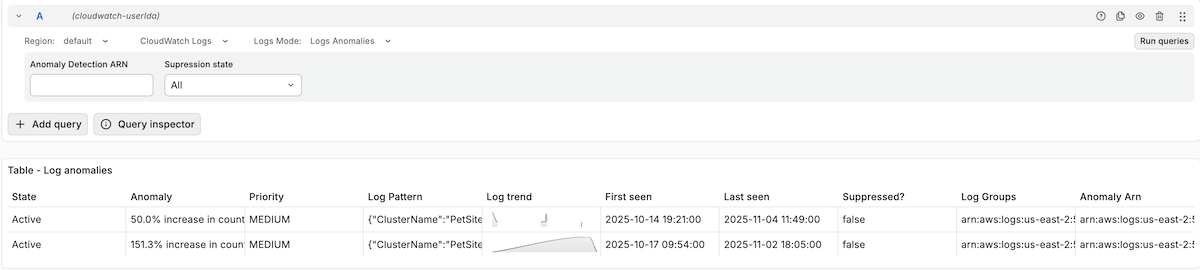
With log anomalies and patterns features, you can now detect abnormalities in your service and group log entries with recurring patterns with the CloudWatch data source.
Grafana CloudGenerally AvailableOpen sourceEnterpriseGenerally Available
Writing PPL queries in the Grafana OpenSearch plugin just got easier with syntax highlighting, suggestions and sample queries.
The PPL query editor now contains a multi-line box which supports syntax highlighting, PPL keywords and commands suggestions, and index fields. To see the new features in action, select PPL in the Query type dropdown of the query editor and start typing. Specify index name(s) in the datasource configuration to narrow down the list of suggested index fields.
We have also added a “Kickstart your query” button to the PPL query editor, which contains useful sample queries. Select a query to copy it to the query editor and edit it further.
Grafana CloudAvailable in public previewEnterpriseAvailable in public preview
Data sourcesPlugins
Introducing SolarWinds data source plugin.
SolarWinds is a network and infrastructure monitoring platform that provides tools to monitor, manage network performance, server health, and application availability.
Grafana CloudGenerally AvailableOpen sourceEnterpriseGenerally Available
Authentication and authorizationBreaking change
Grafana now only gives users automatic Admin access when they create a dashboard or folder at the root level.
If a user creates a dashboard or folder inside another folder, Grafana will not add a direct Admin permission for that user on the new resource. Instead, access should come from the permissions on the containing folder.
Grafana CloudGenerally AvailableOpen sourceEnterpriseGenerally Available
Authentication and authorizationBreaking change
Provisioning now enforces a full-replace model for resource permissions.
When a permission is applied through provisioning, all previously configured permissions on that resource are removed, except for the default role: Admin (admin).