
Add variables
The following table lists the types of variables shipped with Grafana.
Enter General options
You must enter general options for any type of variable that you create. To create a variable, follow these steps:
Click Edit in the top-right corner of the dashboard.
Click Settings.
Go to the Variables tab.
Click Add variable, or if there are already existing variables, + New variable.
Choose an option in the Select variable type drop-down list.
Enter a Name for the variable.
(Optional) In the Label field, enter the display name for the variable drop-down list.
If you don’t enter a display name, then the drop-down list label is the variable name.
Choose a Display option:
- Above dashboard - The variable drop-down list displays above the dashboard with the variable Name or Label value. This is the default.
- Above dashboard, label hidden - The variable drop-down list displays above the dashboard, but without showing the name of the variable.
- Controls menu - The variable is displayed in the dashboard controls menu instead of above the dashboard. The dashboard controls menu appears as a button in the dashboard toolbar.
- Hidden - No variable drop-down list is displayed on the dashboard.
Click one of the following links to complete the steps for adding your selected variable type:
Variable best practices
- Variable drop-down lists are displayed in the order in which they’re listed in the Variables in dashboard settings, so put the variables that you will change often at the top, so they will be shown first (far left on the dashboard).
- By default, variables don’t have a default value. This means that the topmost value in the drop-down list is always preselected. If you want to pre-populate a variable with an empty value, you can use the following workaround in the variable settings:
- Select the Include All Option checkbox.
- In the Custom all value field, enter a value like
.+.
Add a query variable
Query variables enable you to write a data source query that can return a list of metric names, tag values, or keys. For example, a query variable might return a list of server names, sensor IDs, or data centers. The variable values change as they dynamically fetch options with a data source query.
Query variables are generally only supported for strings. If your query returns numbers or any other data type, you might need to convert them to strings to use them as variables. For the Azure data source, for example, you can use the tostring function for this purpose.
Query expressions can contain references to other variables and in effect create linked variables. Grafana detects this and automatically refreshes a variable when one of its linked variables change.
Note
Query expressions are different for each data source. For more information, refer to the documentation for your data source.
Under the Query options section of the page, select a target data source in the Data source drop-down list. You can also click Open advanced data source picker to see more options, including adding a data source (Admins only). For more information about data sources, refer to Add a data source.
In the Query type drop-down list, select an option and fill in the query fields accordingly.
- The query field varies according to your data source. Some data sources have custom query editors.
- Each data source defines how the variable values are extracted. The typical implementation uses every string value returned from the data source response as a variable value. Make sure to double-check the documentation for the data source.
- Some data sources let you provide custom “display names” for the values. For instance, the PostgreSQL, MySQL, and Microsoft SQL Server plugins handle this by looking for fields named
__textand__valuein the result. Other data sources may look fortextandvalueor use a different approach. Always remember to double-check the documentation for the data source. - If you need more room in a single input field query editor, then hover your cursor over the lines in the lower right corner of the field and drag downward to expand.
(Optional) In the Regex field, type a regular expression to filter or capture specific parts of the names returned by your data source query. To see examples, refer to Filter variables with a regular expression.
Under Apply regex to, select Variable value or Display text to choose where the regex pattern is applied. The default is Variable value.
In the Sort drop-down list, select the sort order for values to be displayed in the dropdown list. The default option, Disabled, means that the order of options returned by your data source query is used.
Under Refresh, select when the variable should update options:
- On dashboard load - Queries the data source every time the dashboard loads. This slows down dashboard loading, because the variable query needs to be completed before dashboard can be initialized.
- On time range change - Queries the data source every time the dashboard loads and when the dashboard time range changes. Use this option if your variable options query contains a time range filter or is dependent on the dashboard time range.
(Optional) In the Static options section of the page, toggle on the Use static options switch to add custom options in addition to the query results:
- Make entries in the Value and Display text fields.
- Click + Add new option to add another static option.
- Repeat these steps as many times as needed.
(Optional) Configure the settings in the Selection Options section:
- Multi-value - Enables multiple values to be selected at the same time.
- Allow custom values - Enables users to add custom values to the list.
- Include All option - Enables an option to include all variables. Enter a value in the Custom all value field to set your own “all” option.
In the Preview of values section, Grafana displays a list of the current variable values. Review them to ensure they match what you expect.
Click Save dashboard.
Click Back to dashboard and Exit edit.
Add a custom variable
Use a custom variable for a value that does not change, such as a number or a string.
For example, if you have server names or region names that never change, then you might want to create them as custom variables rather than query variables. Because they do not change, you might use them in chained variables rather than other query variables. That would reduce the number of queries Grafana must send when chained variables are updated.
Under the Custom options section of the page, select one of the following:
- CSV - Enter a flat list of values for the variable in a comma-separated list. You can include numbers, strings, or key/value pairs separated by a space and a colon. For example,
key1 : value1,key2 : value2. - JSON - Provide a JSON array of objects where each object can have any number of properties that can be referenced. For more information refer, to Configure multi-property variables.
- CSV - Enter a flat list of values for the variable in a comma-separated list. You can include numbers, strings, or key/value pairs separated by a space and a colon. For example,
(Optional) Configure the settings in the Selection Options section:
- Multi-value - Enables multiple values to be selected at the same time.
- Allow custom values - Enables users to add custom values to the list. Only applies to CSV custom values.
- Include All option - Enables an option to include all variables.
In the Preview of values section, Grafana displays a list of the current variable values. If you’ve entered a JSON array, the preview is a table that includes all the value properties. Review them to ensure they match what you expect.
Click Save dashboard.
Click Back to dashboard and Exit edit.
Add a text box variable
Text box variables display a free text input field with an optional default value. This is the most flexible variable, because you can enter any value. Use this type of variable if you have metrics with high cardinality or if you want to update multiple panels in a dashboard at the same time.
For more information about cardinality, refer to What are cardinality spikes and why do they matter?
(Optional) Under the Text options section of the page, in the Default value field, enter the default value for the variable.
If you do not enter anything in this field, then Grafana displays an empty text box for users to type text into.
Click Save dashboard.
Click Back to dashboard and Exit edit.
Add a constant variable
Constant variables enable you to define a hidden constant. This is useful for metric path prefixes for dashboards you want to share. When you export a dashboard, constant variables are converted to import options.
Constant variables are not flexible. Each constant variable only holds one value, and it cannot be updated unless you update the variable settings.
Constant variables are useful when you have complex values that you need to include in queries but don’t want to retype in every query. For example, if you had a server path called i-0b6a61efe2ab843gg, then you could replace it with a variable called $path_gg.
Under the Constant options section of the page, in the Value field, enter the variable value.
You can enter letters, numbers, and symbols. You can even use wildcards if you use raw format.
Click Save dashboard.
Click Back to dashboard and Exit edit.
Add a data source variable
Data source variables enable you to quickly change the data source for an entire dashboard. They are useful if you have multiple instances of a data source, perhaps in different environments.
Under the Data source options section of the page, in the Type drop-down list, select the target data source for the variable.
(Optional) In Instance name filter, enter a regular expression filter for which data source instances to choose from in the variable value drop-down list.
Leave this field empty to display all instances.
(Optional) Configure the settings in the Selection Options section:
- Multi-value - Enables multiple values to be selected at the same time.
- Include All option - Enables an option to include all variables.
In the Preview of values section, Grafana displays a list of the current variable values. Review them to ensure they match what you expect.
Click Save dashboard.
Click Back to dashboard and Exit edit.
Add an interval variable
Use an interval variable to represents time spans such as 1m,1h, 1d. You can think of them as a dashboard-wide “group by time” command. Interval variables change how the data is grouped in the visualization. You can also use the Auto Option to return a set number of data points per time span.
You can use an interval variable as a parameter to group by time (for InfluxDB), date histogram interval (for Elasticsearch), or as a summarize function parameter (for Graphite).
Under the Interval options section, in the Values field, enter the time range intervals that you want to appear in the variable drop-down list.
The following time units are supported:
s (seconds),m (minutes),h (hours),d (days),w (weeks),M (months), andy (years). You can also accept or edit the default values:1m,10m,30m,1h,6h,12h,1d,7d,14d,30d.(Optional) Select on the Auto option checkbox if you want to add the
autooption to the list.This option allows you to specify how many times the current time range should be divided to calculate the current
autotime span. If you turn it on, then two more options appear:- Step count - Select the number of times the current time range is divided to calculate the value, similar to the Max data points query option. For example, if the current visible time range is 30 minutes, then the
autointerval groups the data into 30 one-minute increments. The default value is 30 steps. - Min interval - The minimum threshold below which the step count intervals does not divide the time. To continue the 30 minute example, if the minimum interval is set to 2m, then Grafana would group the data into 15 two-minute increments.
- Step count - Select the number of times the current time range is divided to calculate the value, similar to the Max data points query option. For example, if the current visible time range is 30 minutes, then the
In the Preview of values section, Grafana displays a list of the current variable values. Review them to ensure they match what you expect.
Click Save dashboard.
Click Back to dashboard and Exit edit.
Interval variable examples
The following example shows a template variable myinterval in a Graphite function:
summarize($myinterval, sum, false)The following example shows a more complex Graphite example, from the Graphite Template Nested Requests panel:
groupByNode(summarize(movingAverage(apps.$app.$server.counters.requests.count, 5), '$interval', 'sum', false), 2, 'sum')Add ad hoc filters
Ad hoc filters are one of the most complex and flexible variable options available. Instead of creating a variable for each dimension by which you want to filter, ad hoc filters automatically create variables (key/value pairs) for all the dimensions returned by your data source query. This allows you to apply filters dashboard-wide.
Ad hoc filters let you add label/value filters that are automatically added to all metric queries that use the specified data source. Unlike other variables, you don’t use ad hoc filters in queries. Instead, you use ad hoc filters to write filters for existing queries.
The following data sources support ad hoc filters:
- Dashboard - Use this special data source to apply ad hoc filters to data from unsupported data sources.
- Prometheus
- Loki
- InfluxDB
- Elasticsearch
- OpenSearch
To create an ad hoc filter, follow these steps:
Under the Ad-hoc options section of the page, select a target data source in the Data source drop-down list.
You can also click Open advanced data source picker to see more options, including adding a data source (Admins only). For more information about data sources, refer to Add a data source.
(Optional) To provide the filter dimensions as comma-separated values (CSV), toggle the Use static key dimensions switch on, and then enter the values in the space provided.
Click Save dashboard.
Enter an optional description of your dashboard changes, and then click Save.
Click Back to dashboard and Exit edit.
Now you can filter data on the dashboard.
Tip
You can use data links to link back to the dashboard you are currently on. This enables “panel-to-panel filtering,” where clicking a data point in one panel updates the dashboard variables and filters the rest of the dashboard.
To preserve the context of the current dashboard:
- Time range: You must explicitly include the current time range in the link.
- Variables: You must enable Include all variables to preserve existing selections.
- Ordering: Ensure that Include all variables is placed before the specific variable you are defining in the link.
Ad hoc filters on the current dashboard are automatically preserved.
Learn more in:
Filter any data using the Dashboard data source
In cases where a data source doesn’t support the use of ad hoc filters, you can use the Dashboard data source to reference that data, and then filter it in a new panel. This allows you to bypass the limitations of the data source in the source panel.
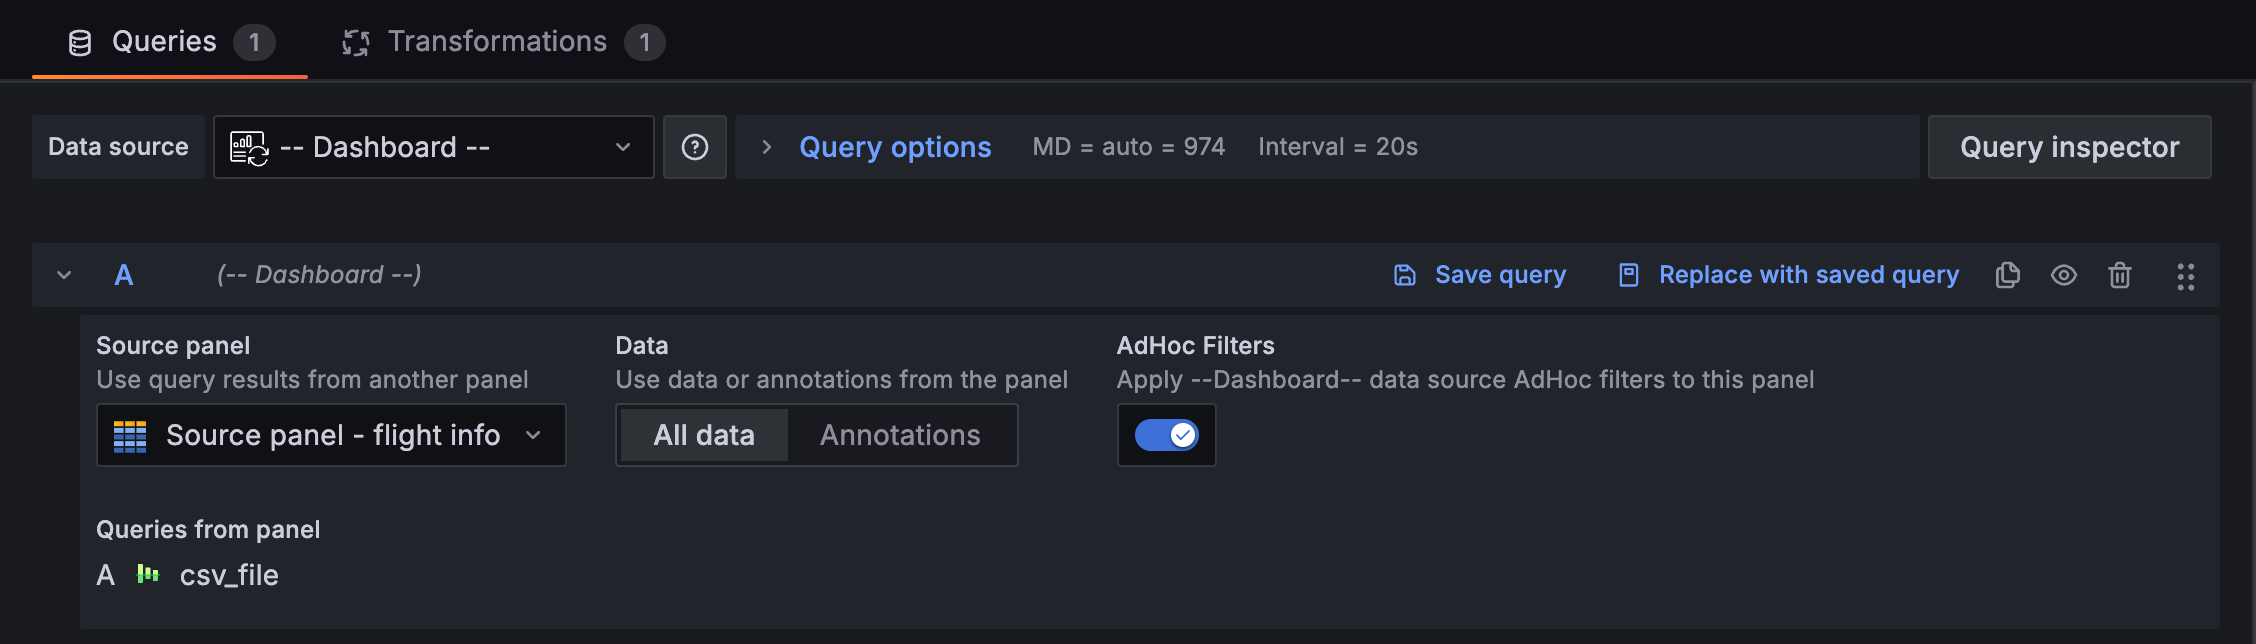
To use ad hoc filters on data from an unsupported data source, follow these steps:
Navigate to the dashboard with the panel with the data you want to filter.
Click Edit in top-right corner of the dashboard.
At the top of the dashboard, click Add and select Visualization in the drop-down list.
In the Queries tab of the edit panel view, enter
Dashboardin the Data source field and select – Dashboard –.In the query configuration section, make the following selections:
- Source panel - Choose the panel with the source data.
- Data - Select All Data to use the data of the panel, and not just the annotations. This is the default selection.
- AdHoc Filters - Toggle on the switch to make the data from the referenced panel filterable.
Note
If you’re referencing multiple panels in a dashboard with the Dashboard data source, you can only use one of those source panels at a time for ad hoc filtering.
Configure any other needed options for the panel.
Click Save dashboard.
Now you can filter the data from the source panel by way of the Dashboard data source. Add as many panels as you need.
Dashboard drilldown with ad hoc filters
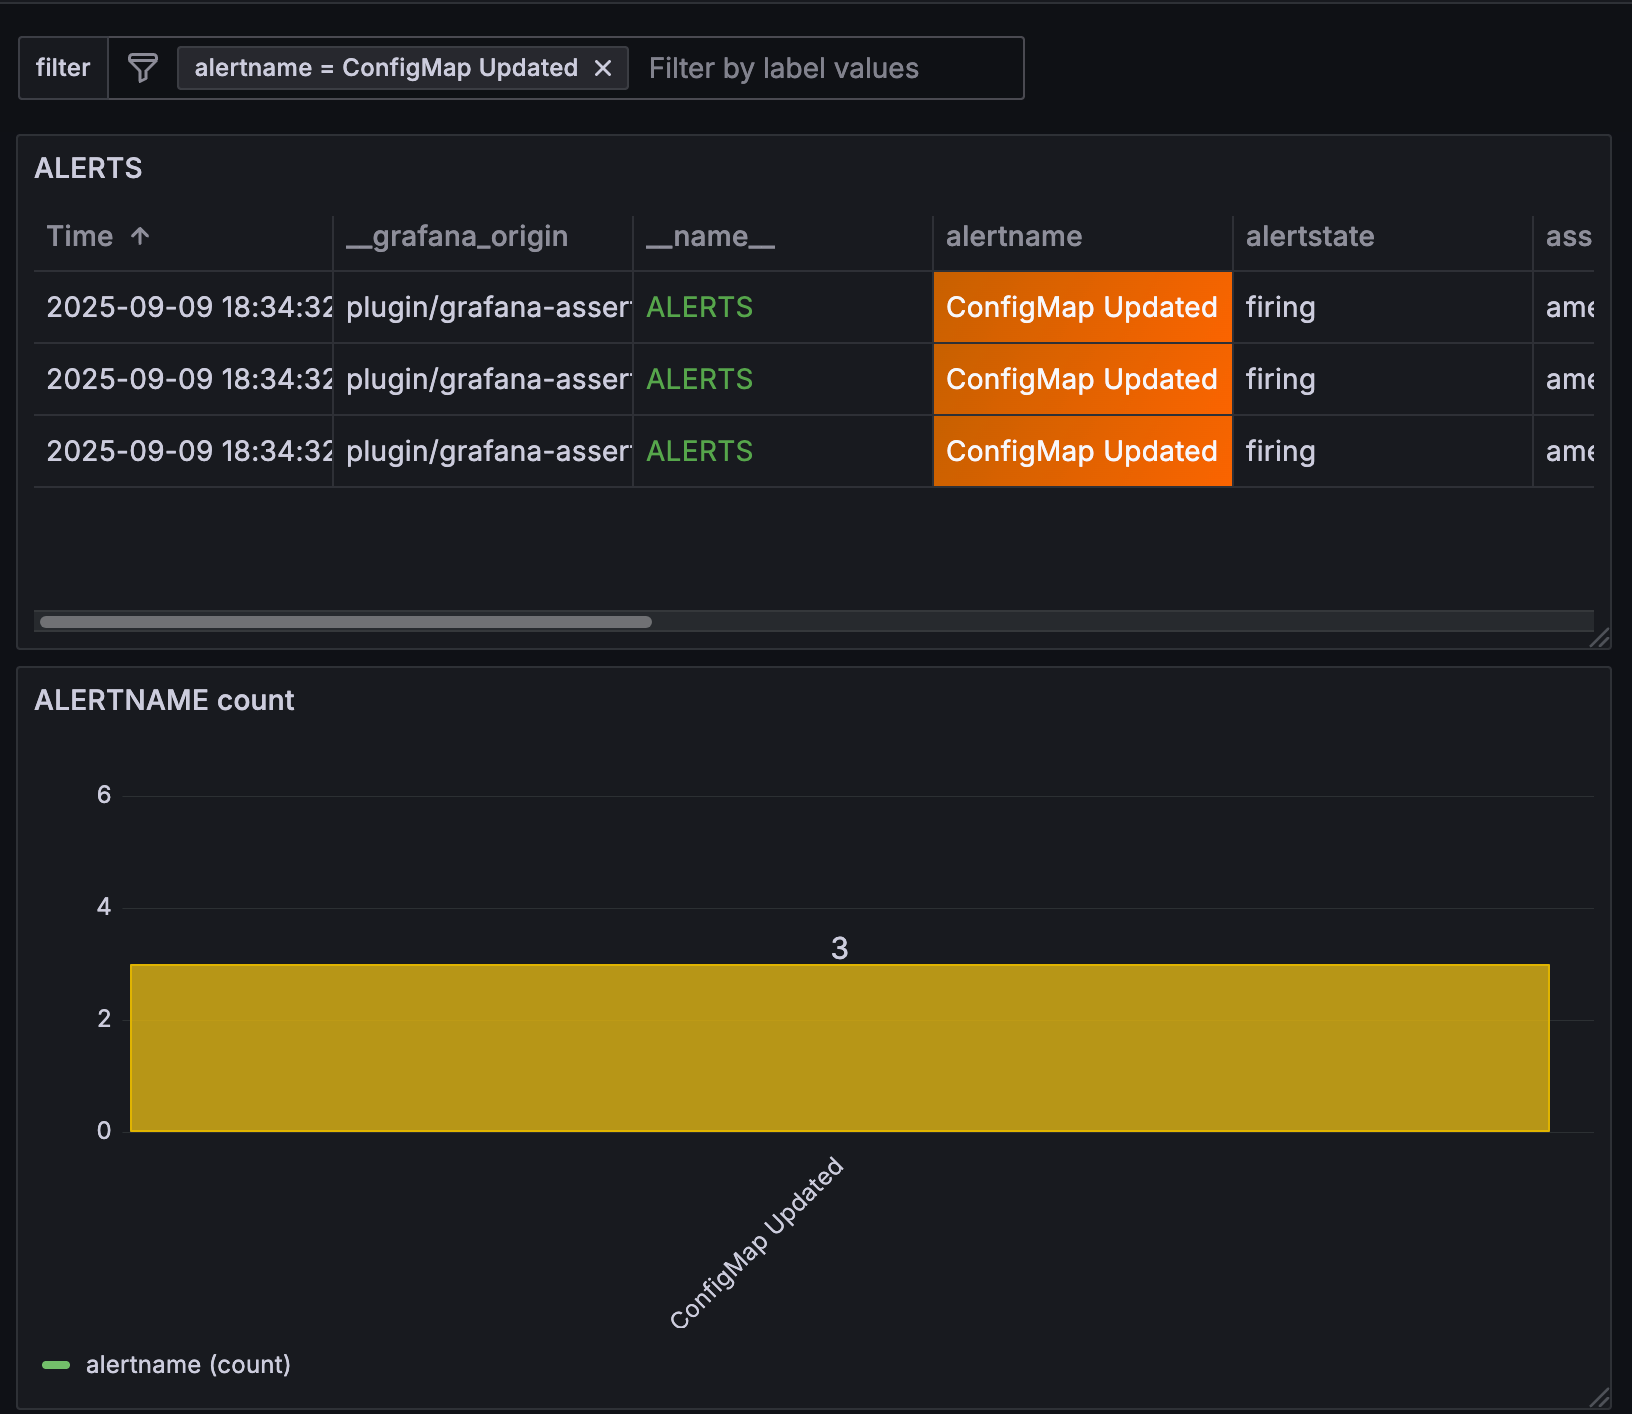
In table and bar chart visualizations, you can apply ad hoc filters directly from the visualization. To quickly apply ad hoc filter variables, follow these steps:
To display the filter icons, hover your cursor over the table cell with the value for which you want to filter. In this example, the cell value is
ConfigMap Updated, which is in thealertnamecolumn:![Table and bar chart with ad hoc filter icon displayed on a table cell]()
In bar chart visualizations, hover and click the bar to display the filter button:
![The ad hoc filter button in a bar chart tooltip]()
Click the add filter icon.
The variable pair
alertname = ConfigMap Updatedis added to the ad hoc filter and all panels using the same data source that include that variable value are filtered by that value:![Table and bar chart, filtered]()
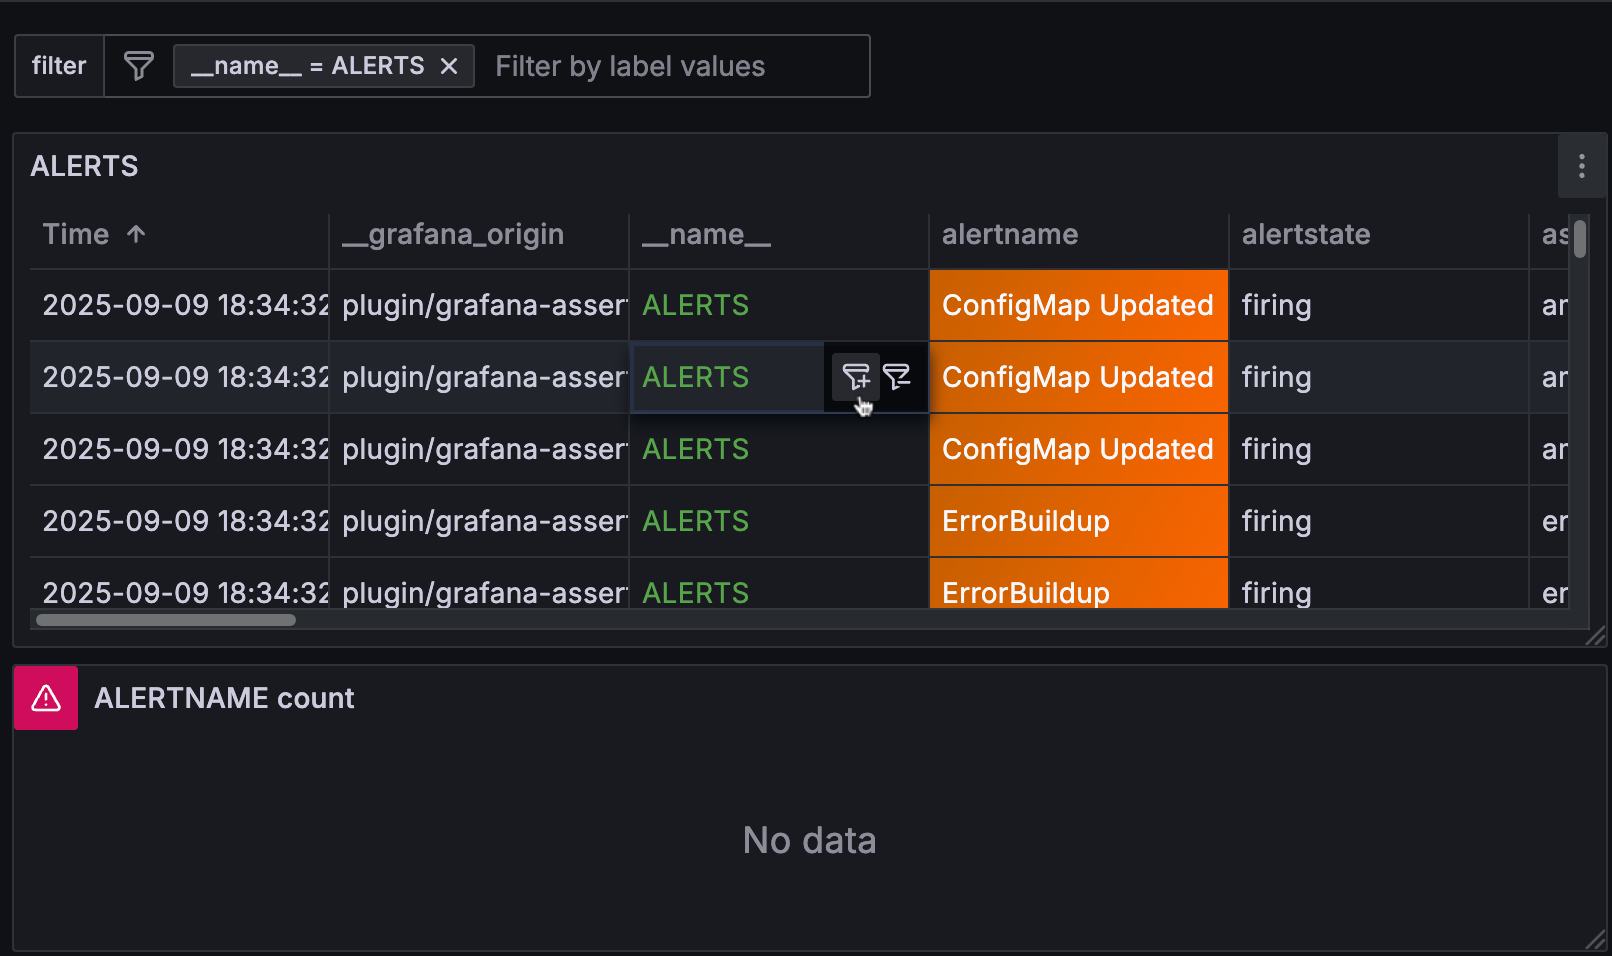
If one of the panels in the dashboard using that data source doesn’t include that variable value, the panel won’t return any data. In this example, the variable pair _name_ = ALERTS has been added to the ad hoc filter so the bar chart doesn’t return any results:
In cases where the data source you’re using doesn’t support ad hoc filtering, consider using the special Dashboard data source. For more information, refer to Filter any data using the Dashboard data source.
Add a switch variable
Switch variables display a switch with two configurable values representing enabled and disabled states. This variable type is useful when you need to:
- Toggle between different query conditions
- Enable or disable specific filters
- Switch between different visualization modes
- Control boolean parameters in your data sources
Under the Switch options section of the page, configure the switch values:
In the Value pair type drop-down list, select one of the following predefined options or choose Custom to define your own values:
- True / False - Uses boolean values
trueandfalse - 1 / 0 - Uses numeric values
1and0 - Yes / No - Uses string values
yesandno - Custom - Allows you to define custom values for both enabled and disabled states
- True / False - Uses boolean values
If you selected Custom in the previous step, configure the custom values:
- Enabled value - Enter the value that represents the enabled state (for example, “on”).
- Disabled value - Enter the value that represents the disabled state (for example, “off”).
Click Save dashboard.
Click Back to dashboard and Exit edit.
Switch variable examples
The following example shows a switch variable $debug_mode used in a Prometheus query to conditionally include debug labels:
up{job="my-service"} and ($debug_mode == "true" or on() vector(0))The following example shows a switch variable $show_errors used to filter log entries:
{job="application"} |= ($show_errors == "1" ? "ERROR" : "")You can also use switch variables in panel titles and other dashboard elements:
{{#if debug_mode}}Debug Mode: {{/if}}Application MetricsConfigure variable selection options
Selection Options are a feature you can use to manage variable option selections. All selection options are optional, and they are off by default.
Multi-value variables
Interpolating a variable with multiple values selected is tricky as it is not straight forward how to format the multiple values into a string that is valid in the given context where the variable is used. Grafana tries to solve this by allowing each data source plugin to inform the templating interpolation engine what format to use for multiple values.
Note
The Custom all value option on the variable must be blank for Grafana to format all values into a single string. If it is left blank, then Grafana concatenates (adds together) all the values in the query. Something like
value1,value2,value3. If a customallvalue is used, then instead the value is something like*orall.
Multi-value variables with a Graphite data source
Graphite uses glob expressions. A variable with multiple values would, in this case, be interpolated as {host1,host2,host3} if the current variable value was host1, host2, and host3.
Multi-value variables with a Prometheus or InfluxDB data source
InfluxDB and Prometheus use regular expressions, so the same variable would be interpolated as (host1|host2|host3). Every value would also be regular expression escaped. If not, a value with a regular expression control character would break the regular expression.
Multi-value variables with an Elastic data source
Elasticsearch uses Lucene query syntax, so the same variable would be formatted as ("host1" OR "host2" OR "host3"). In this case, every value must be escaped so that the value only contains Lucene control words and quotation marks.
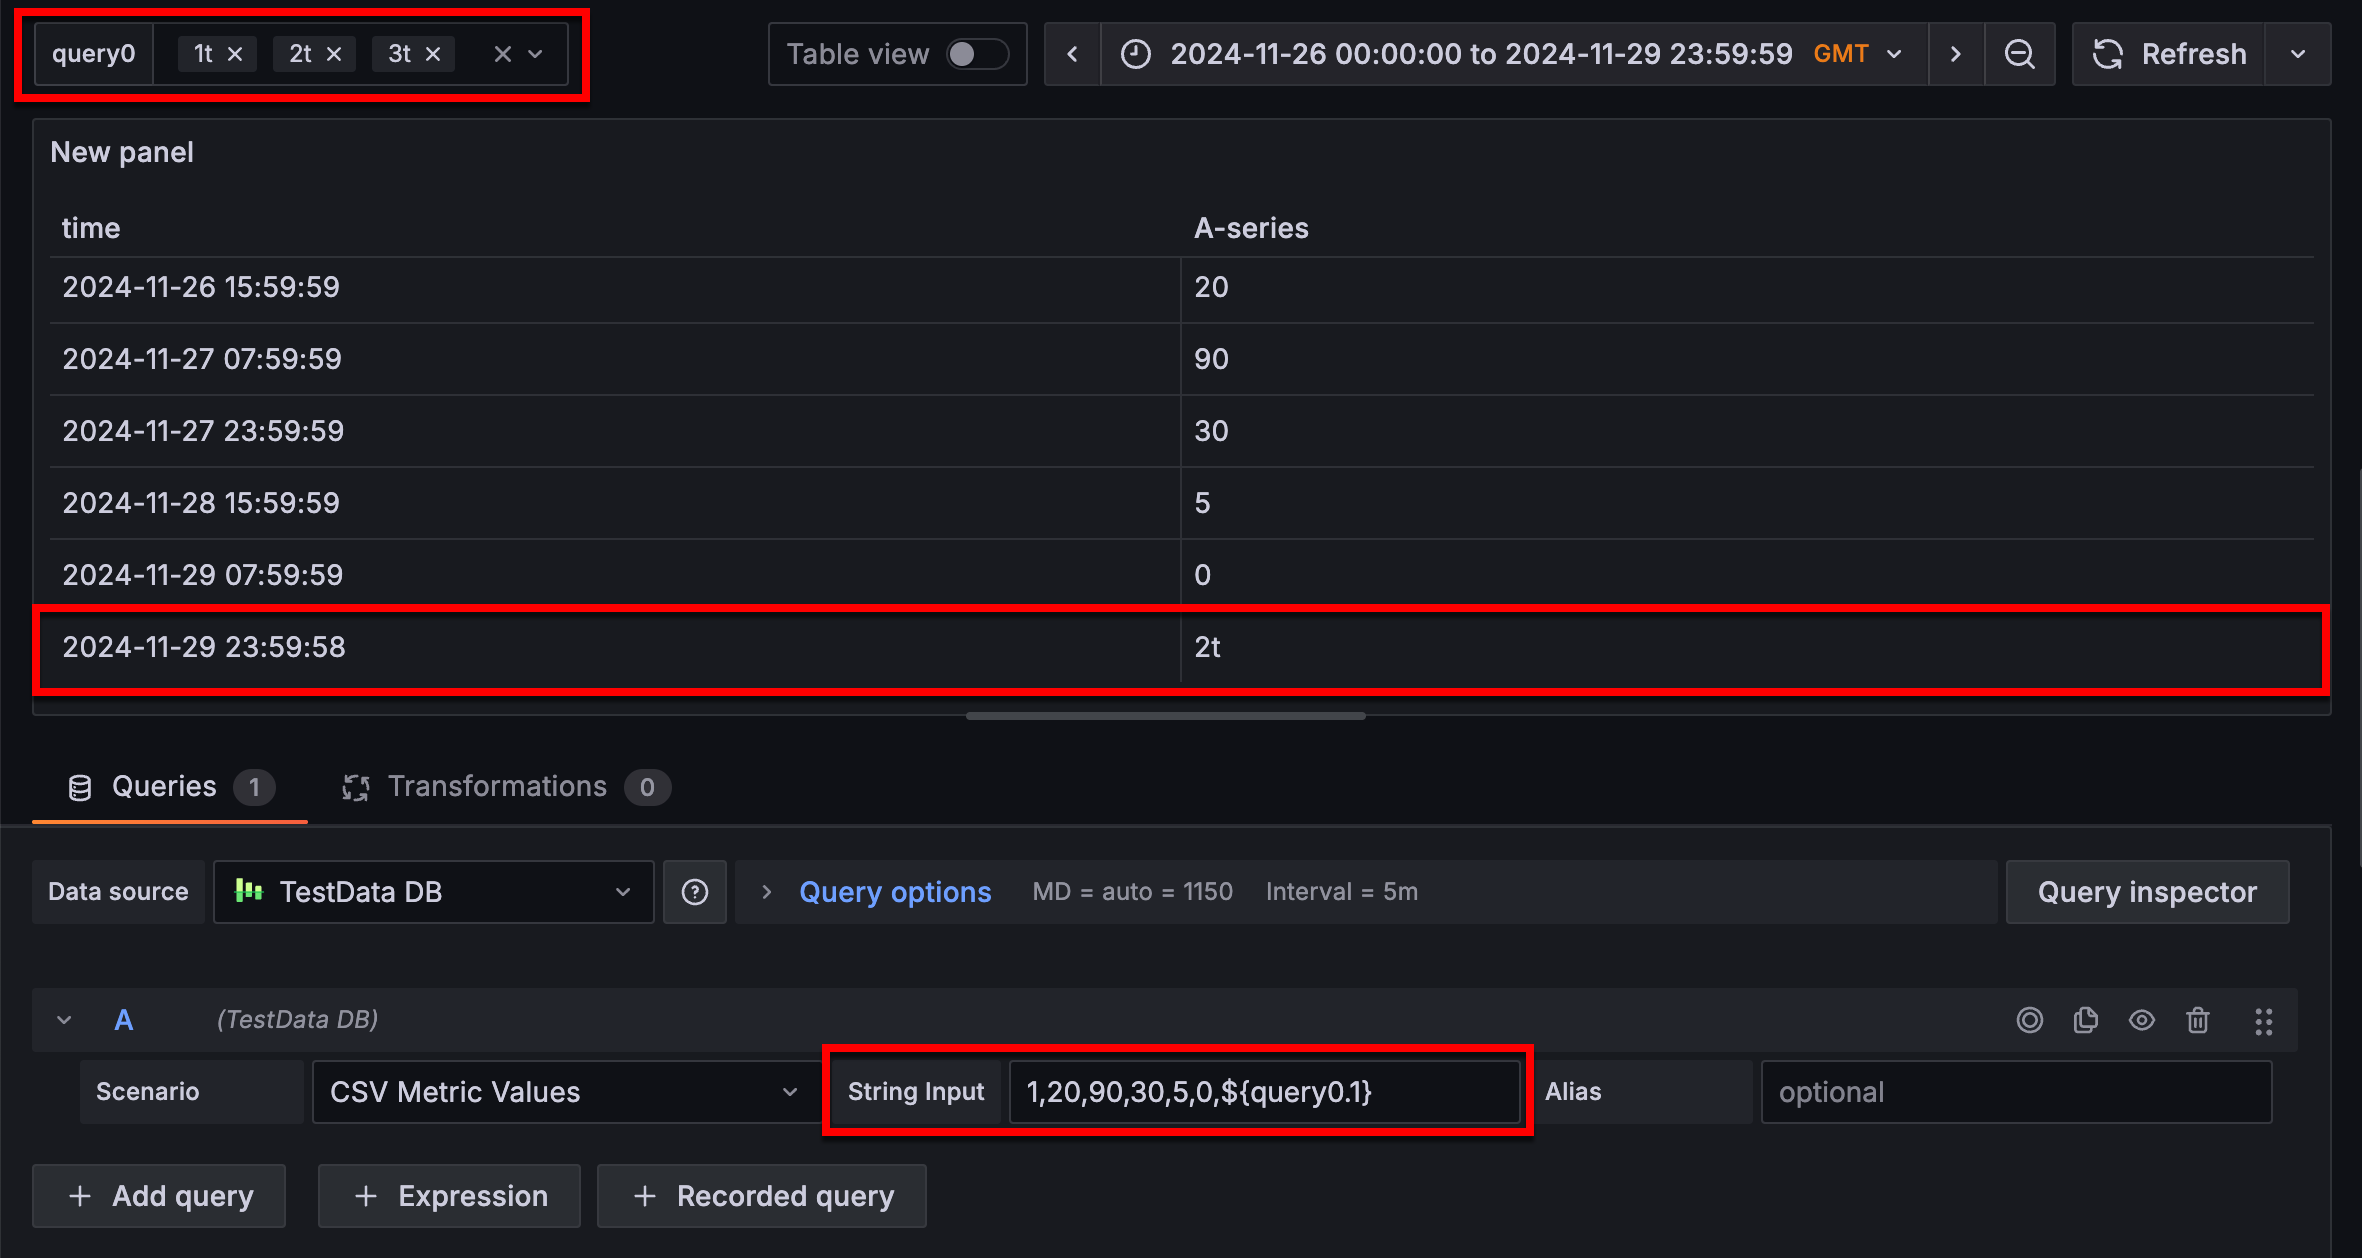
Variable indexing
If you have a multi-value variable that’s formatted as an array, you can use array positions to reference the values rather than the actual values. You can use this functionality in dashboard panels to filter data, and when you do so, the array is maintained.
To reference variable values this way, use the following syntax:
${query0.0}The preceding syntax references the first, or 0, position in the array.
In the following example, there’s an array of three values, 1t, 2t, and 3t, and rather than referencing those values, the panel query references the second value in the array using the syntax ${query0.1}:
Troubleshoot multi-value variables
Automatic escaping and formatting can cause problems and it can be tricky to grasp the logic behind it. Especially for InfluxDB and Prometheus where the use of regular expression syntax requires that the variable is used in regular expression operator context.
If you do not want Grafana to do this automatic regular expression escaping and formatting, then you must do one of the following:
- Turn off the Multi-value or Include All option options.
- Use the raw variable format.
Include All option
Grafana adds an All option to the variable dropdown list. If a user selects this option, then all variable options are selected.
Custom all value
This option is only visible if the Include All option is selected.
Enter regular expressions, globs, or Lucene syntax in the Custom all value field to define the value of the All option.
By default the All value includes all options in combined expression. This can become very long and can have performance problems. Sometimes it can be better to specify a custom all value, like a wildcard regular expression.
In order to have custom regular expression, globs, or Lucene syntax in the Custom all value option, it is never escaped so you have to think about what is a valid value for your data source.
Configure multi-property variables
If you have a multi-source dashboard that uses multiple variables for the same logical concept—for example, an environment identified as dev vs development—, you can set up a multi-property variable to let you reference all those values. Instead of creating and keeping multiple variables for the same logical concept in sync, you can map all of those identifiers to one variable and then reference any property you need in panels and queries.
To do so, configure a JSON array in which each object can have any number of properties. Then, you can reference any of the properties in as you use those variables.
This applies to the following variable types:
- Custom
- Query
- Infinity
- PostgreSQL
Multi-property custom variables
To create a custom variable with multiple properties, define a JSON array, like this:
[
  { "value": "1", "text": "Development", "aws": "dev", "azure": "development", "google": "googledev" },
  { "value": "2", "text": "Staging", "aws": "stag", "azure": "staging", "google": "googlestag" },
  { "value": "3", "text": "Production", "aws": "prod", "azure": "production", "google": "googleprod" }
]
This is how those values are displayed in a preview:
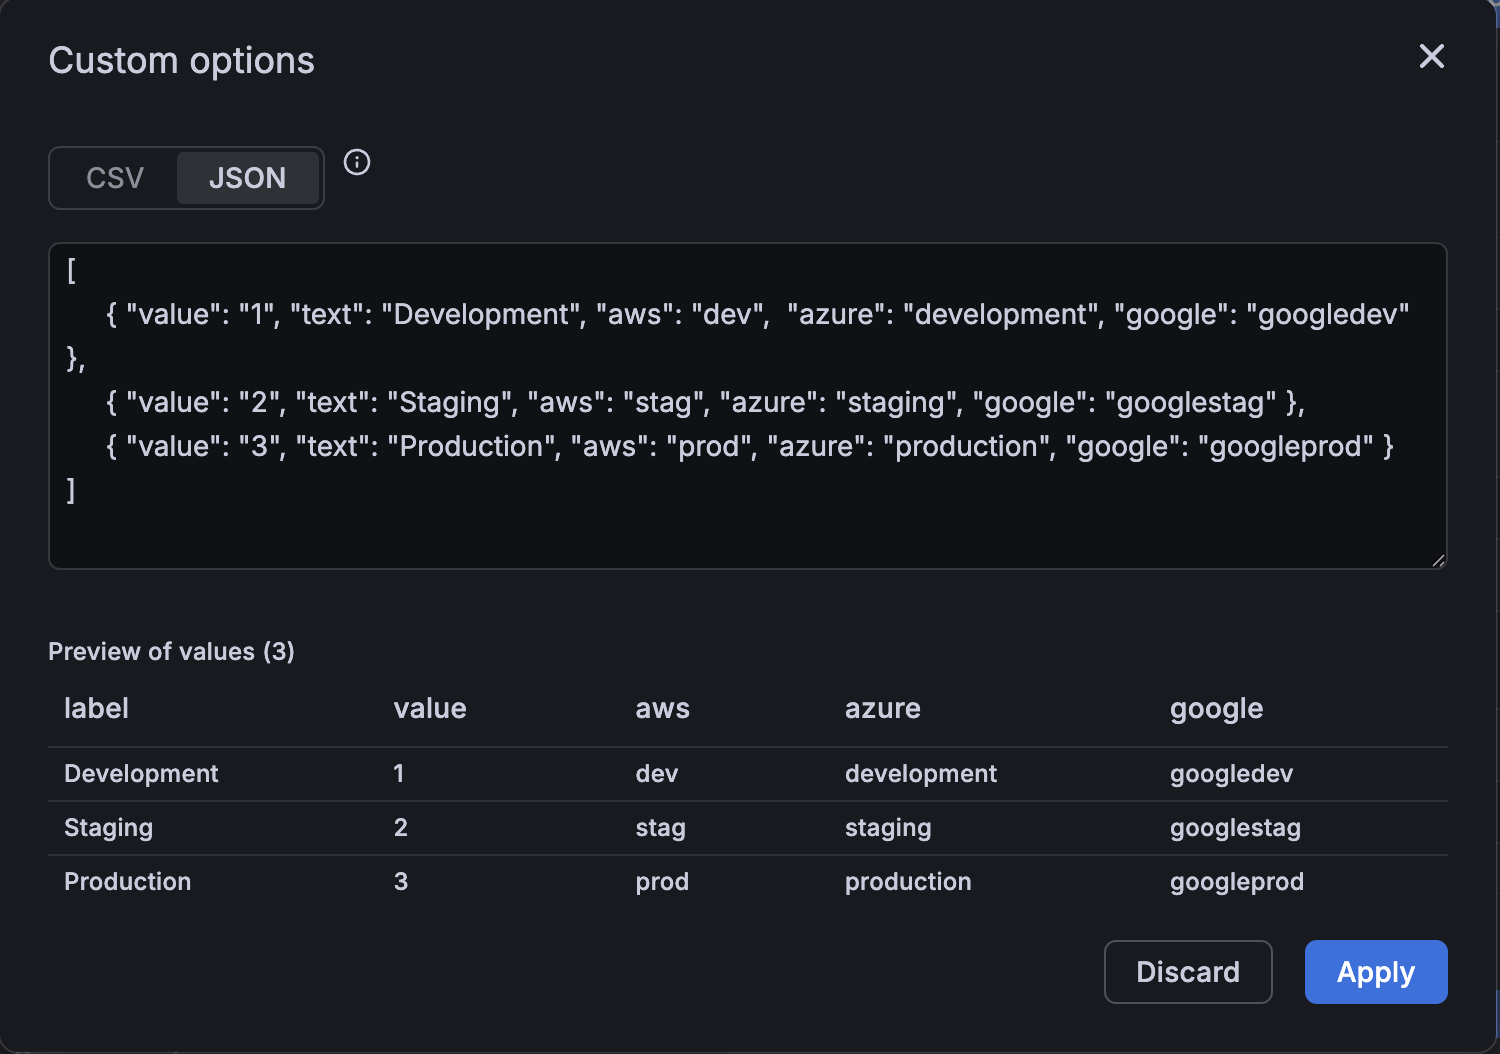
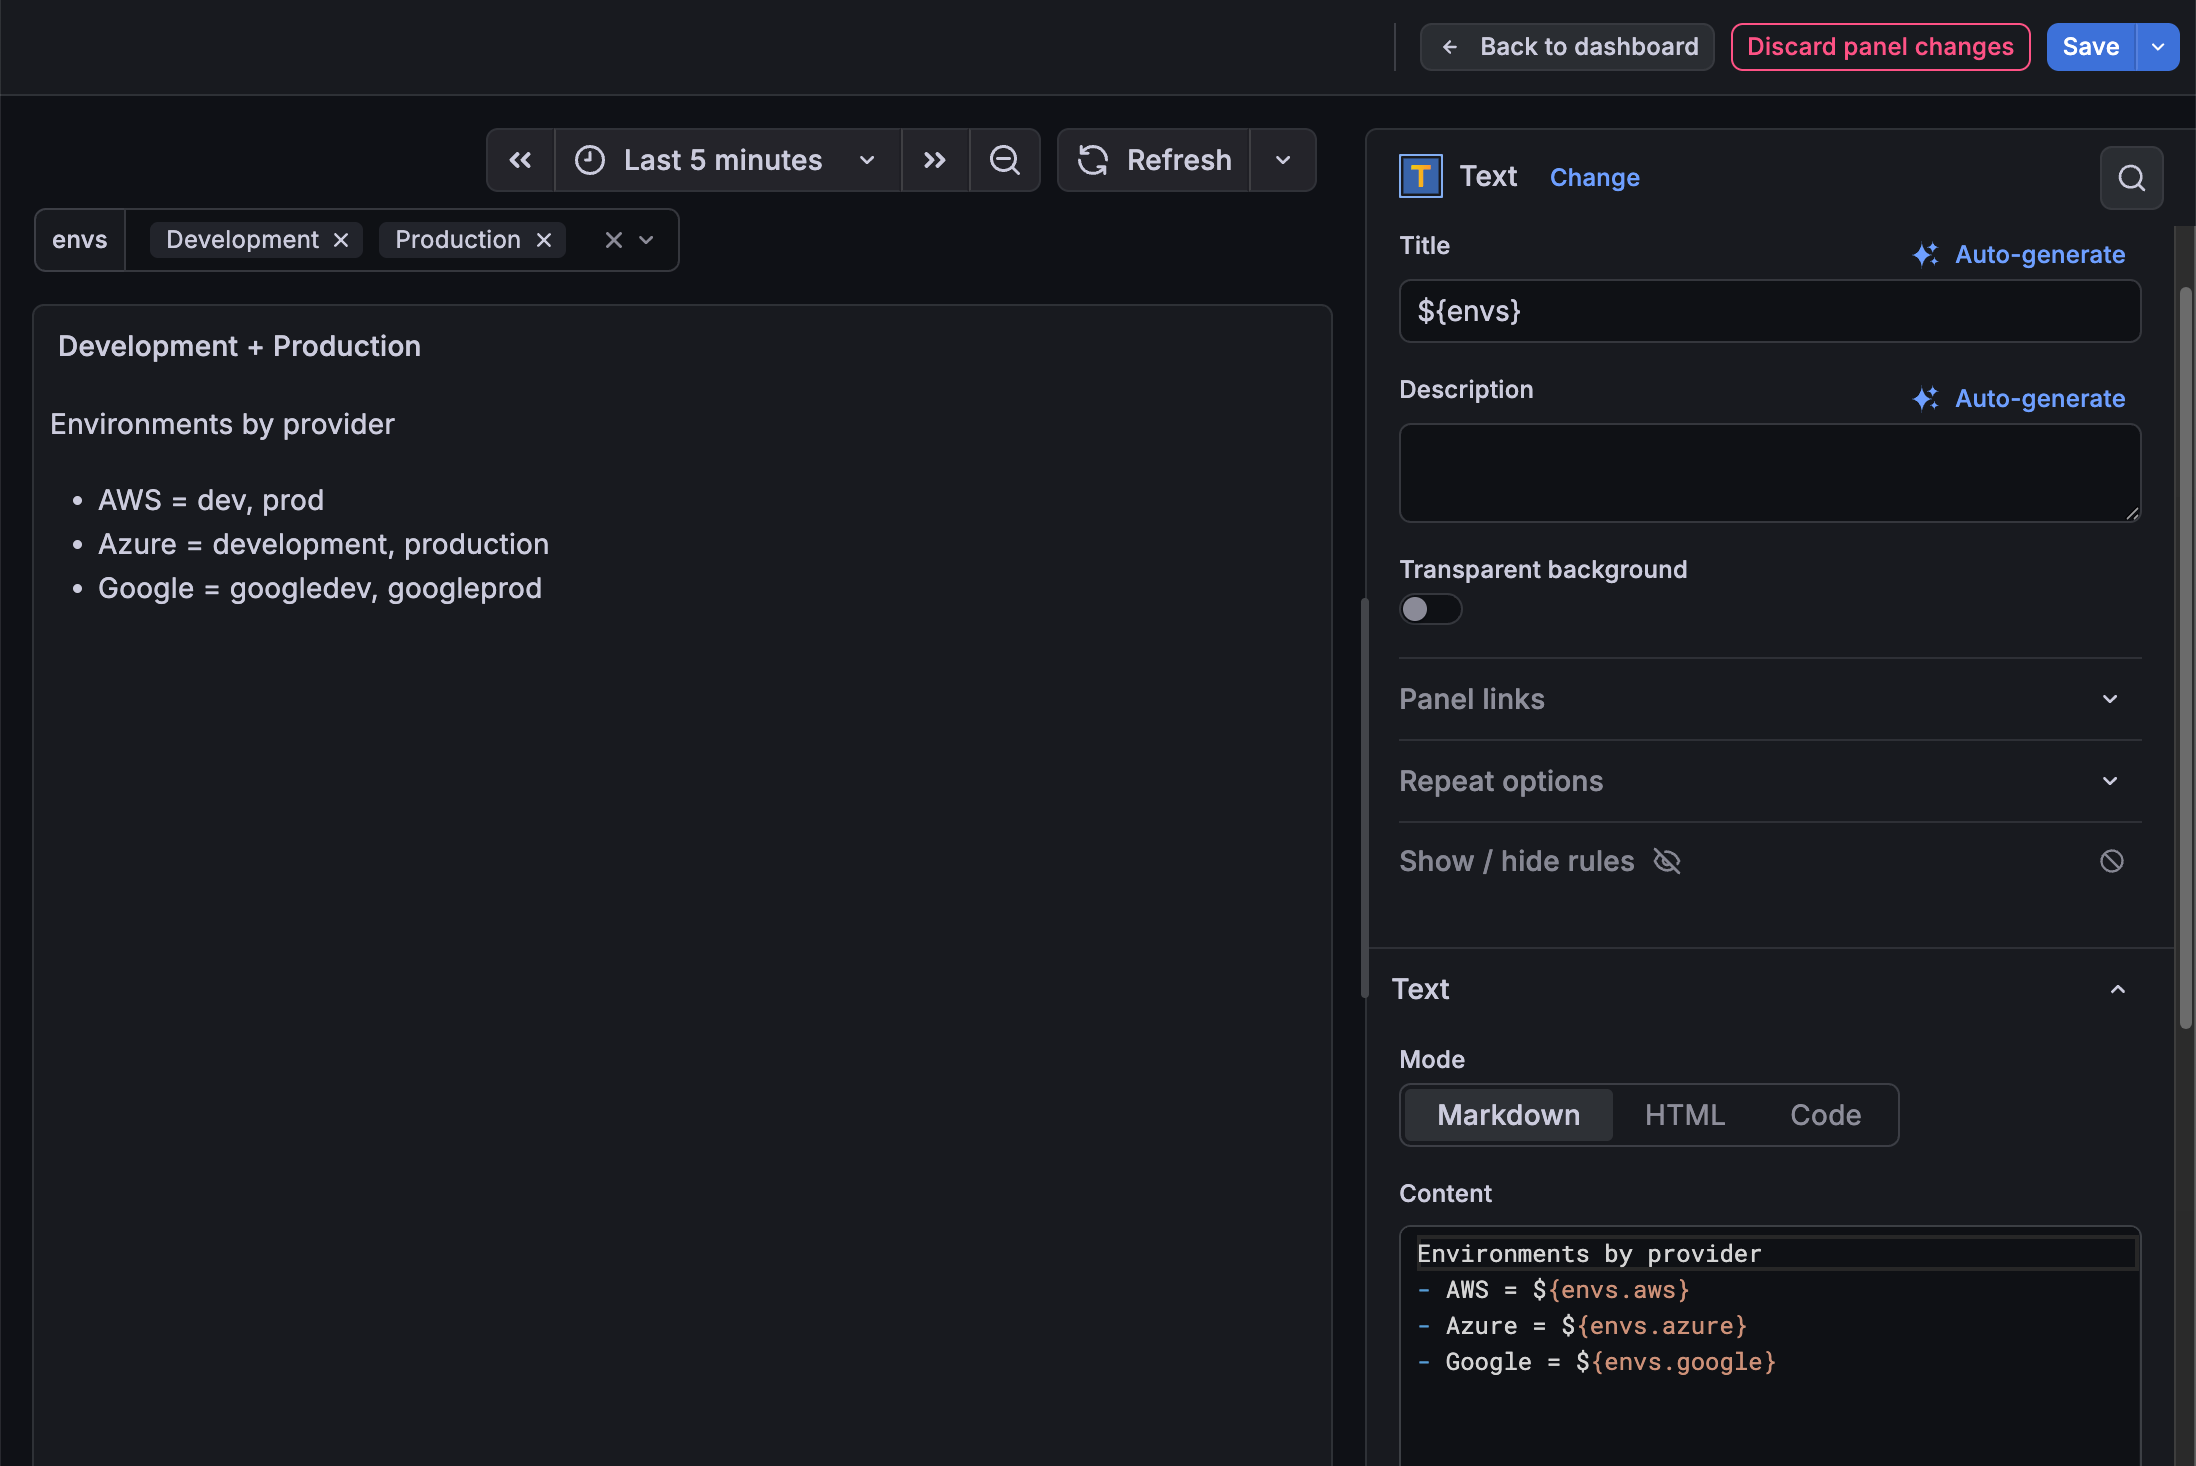
Then you can use ${varName.someProperty} syntax to reference any property in your dashboard panels or metrics:
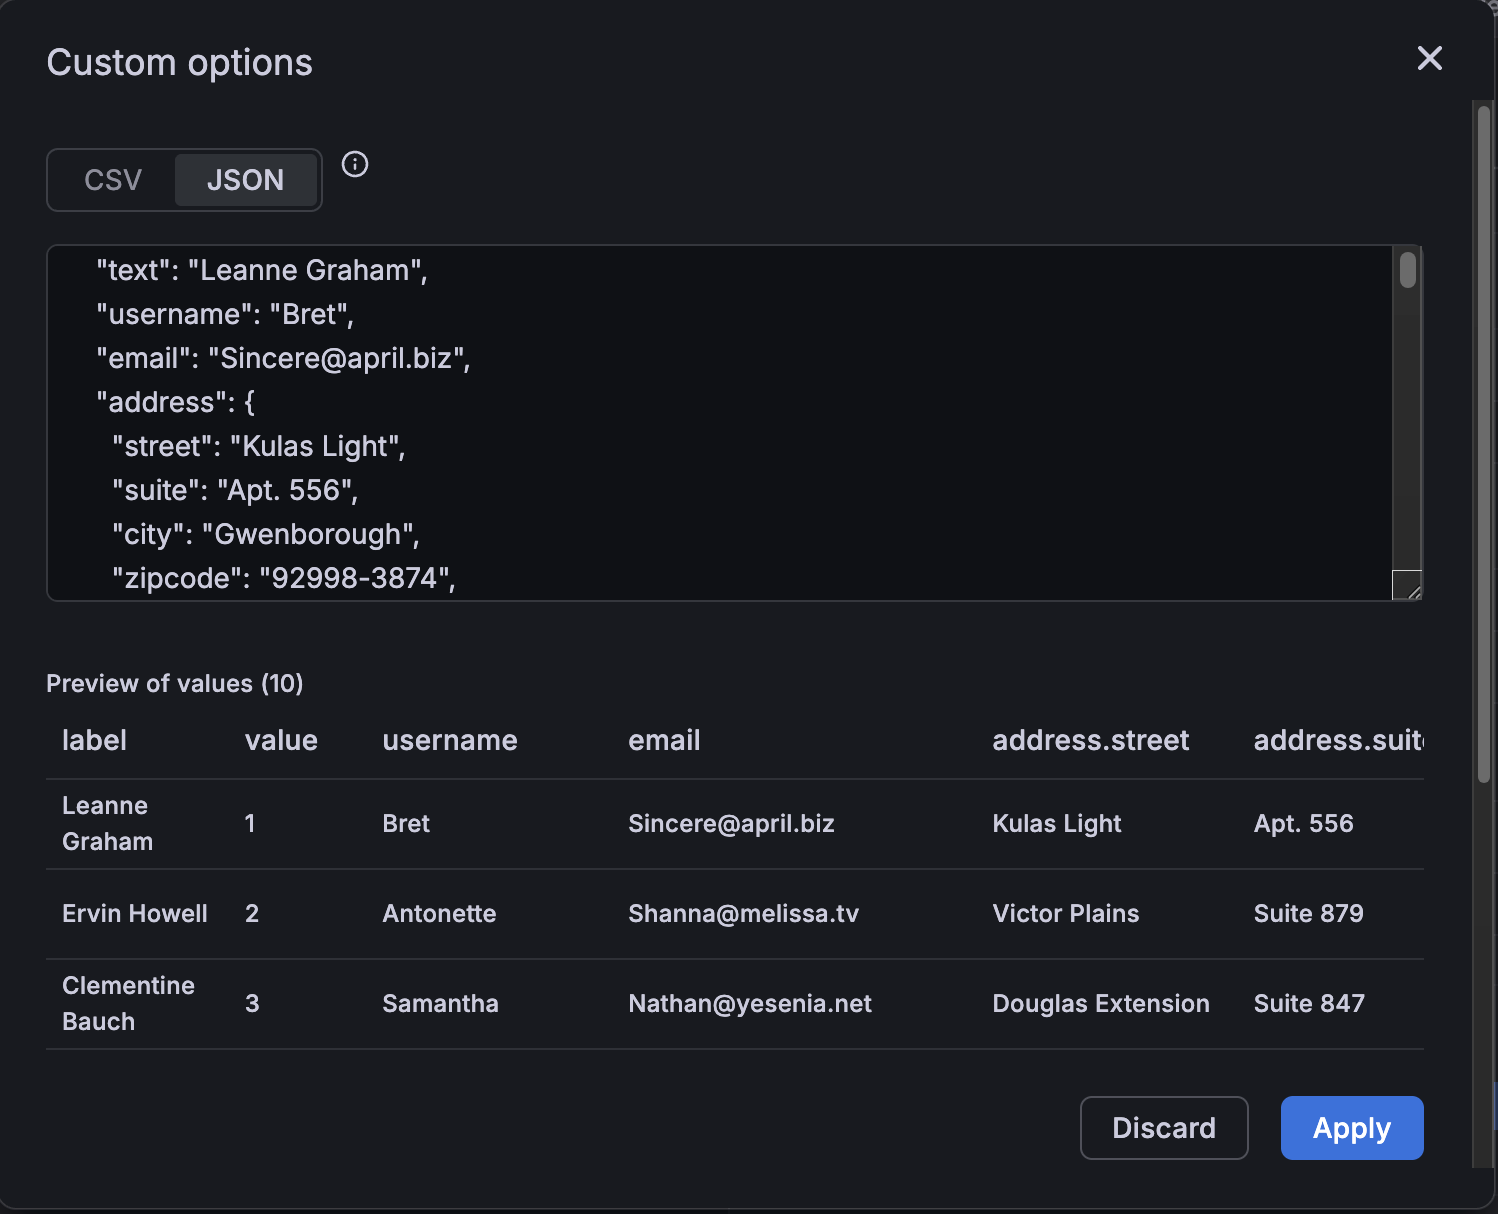
You can even deeply nest properties and still access them using familiar variable syntax. In the following example, each user has an address property with all the elements of an address nested within it:
Multi-property query variables
Because query configuration is different for each data source, there’s no one way to set up a JSON array to create a multi-property query variable. For PostgreSQL, refer to PostgreSQL template variables. For other data sources, refer to the relevant Data sources documentation for preinstalled data source plugins. For configuration information on all other data source plugins, refer to the Plugins documentation.
Global variables
Grafana has global built-in variables that can be used in expressions in the query editor. This topic lists them in alphabetical order and defines them. These variables are useful in queries, dashboard links, panel links, and data links.
$__dashboard
This variable is the name of the current dashboard.
$__from and $__to
Grafana has two built-in time range variables: $__from and $__to. They are currently always interpolated as epoch milliseconds by default, but you can control date formatting.
The syntax above also works with ${__to}.
You can use this variable in URLs, as well. For example, you can send a user to a dashboard that shows a time range from six hours ago until now: https://play.grafana.org/d/000000012/grafana-play-home?viewPanel=2&orgId=1?from=now-6h&to=now
$__interval
You can use the $__interval variable as a parameter to group by time (for InfluxDB, MySQL, Postgres, MSSQL), Date histogram interval (for Elasticsearch), or as a summarize function parameter (for Graphite).
Grafana automatically calculates an interval that can be used to group by time in queries. When there are more data points than can be shown on a graph, then queries can be made more efficient by grouping by a larger interval. It is more efficient to group by 1 day than by 10s when looking at 3 months of data. The graph looks the same and the query is faster. The $__interval is calculated using the time range and the width of the graph (the number of pixels).
Approximate Calculation: (to - from) / resolution
For example, when the time range is 1 hour and the graph is full screen, then the interval might be calculated to 2m - points are grouped in 2 minute intervals. If the time range is 6 months and the graph is full screen, then the interval might be 1d (1 day) - points are grouped by day.
In the InfluxDB data source, the legacy variable $interval is the same variable. $__interval should be used instead.
The InfluxDB and Elasticsearch data sources have Group by time interval fields that are used to hard code the interval or to set the minimum limit for the $__interval variable (by using the > syntax -> >10m).
$__interval_ms
This variable is the $__interval variable in milliseconds, not a time interval formatted string. For example, if the $__interval is 20m then the $__interval_ms is 1200000.
$__name
This variable is only available in the Singlestat panel and can be used in the prefix or suffix fields on the Options tab. The variable is replaced with the series name or alias.
Note
The Singlestat panel is no longer available from Grafana 8.0.
$__org
This variable is the ID of the current organization.
${__org.name} is the name of the current organization.
$__user
${__user.id} is the ID of the current user.
${__user.login} is the login handle of the current user.
${__user.email} is the email for the current user.
$__range
Currently only supported for Prometheus and Loki data sources. This variable represents the range for the current dashboard. It is calculated by to - from. It has a millisecond and a second representation called $__range_ms and $__range_s.
$__rate_interval
Currently only supported for Prometheus data sources. The $__rate_interval variable is meant to be used in the rate function. Refer to
Prometheus query variables for details.
$__rate_interval_ms
This variable is the $__rate_interval variable in milliseconds, not a time-interval-formatted string. For example, if the $__rate_interval is 20m then the $__rate_interval_ms is 1200000.
$timeFilter or $__timeFilter
The $timeFilter variable returns the currently selected time range as an expression. For example, the time range interval Last 7 days expression is time > now() - 7d.
This is used in several places, including:
- The WHERE clause for the InfluxDB data source. Grafana adds it automatically to InfluxDB queries when in Query Editor mode. You can add it manually in Text Editor mode:
WHERE $timeFilter. - Log Analytics queries in the Azure Monitor data source.
- SQL queries in MySQL, Postgres, and MSSQL.
- The
$__timeFiltervariable is used in the MySQL data source.
$__timezone
The $__timezone variable returns the currently selected time zone, either utc or an entry of the IANA time zone database (for example, America/New_York).
If the currently selected time zone is Browser Time, Grafana tries to determine your browser time zone.
Chained variables
Chained variables, also called linked variables or nested variables, are query variables with one or more other variables in their variable query. This section explains how chained variables work and provides links to example dashboards that use chained variables.
Chained variable queries are different for every data source, but the premise is the same for all. You can use chained variable queries in any data source that allows them.
Extremely complex linked templated dashboards are possible, 5 or 10 levels deep. Technically, there is no limit to how deep or complex you can go, but the more links you have, the greater the query load.
Grafana Play dashboard examples
The following Grafana Play dashboards contain fairly simple chained variables, only two layers deep. To view the variables and their settings, click Edit and then Settings; then go to the Variables tab. Both examples are expanded in the following section.
Examples explained
Variables are useful to reuse dashboards and dynamically change what is shown in dashboards. Chained variables are especially useful to filter what you see.
Create parent/child relationship in a variable, sort of a tree structure where you can select different levels of filters.
The following sections explain the linked examples in the dashboards above in depth and builds on them. While the examples are data source-specific, the concepts can be applied broadly.
Graphite example
In this example, there are several applications. Each application has a different subset of servers. It is based on the Graphite Templated Nested.
Now, you could make separate variables for each metric source, but then you have to know which server goes with which app. A better solution is to use one variable to filter another. In this example, when the user changes the value of the app variable, it changes the dropdown options returned by the server variable. Both variables use the Multi-value option and Include all option, enabling users to select some or all options presented at any time.
app variable
The query for this variable basically says, “Find all the applications that exist.”
apps.*The values returned are backend, country, fakesite, and All.
server variable
The query for this variable basically says, “Find all servers for the currently chosen application.”
apps.$app.*If the user selects backend, then the query changes to:
apps.backend.*The query returns all servers associated with backend, including backend_01, backend_02, and so on.
If the user selects fakesite, then the query changes to:
apps.fakesite.*The query returns all servers associated with fakesite, including web_server_01, web_server_02, and so on.
More variables
Note
This example is theoretical. The Graphite server used in the example does not contain CPU metrics.
The dashboard stops at two levels, but you could keep going. For example, if you wanted to get CPU metrics for selected servers, you could copy the server variable and extend the query so that it reads:
apps.$app.$server.cpu.*This query basically says, “Find the CPU metrics for the selected server.”
Depending on what variable options the user selects, you could get queries like:
apps.backend.backend_01.cpu.*
apps.{backend.backend_02,backend_03}.cpu.*
apps.fakesite.web_server_01.cpu.*
InfluxDB example
In this example, you have several data centers. Each data center has a different subset of hosts. It is based on the InfluxDB Templated dashboard.
In this example, when the user changes the value of the datacenter variable, it changes the dropdown options returned by the host variable. The host variable uses the Multi-value option and Include all option, allowing users to select some or all options presented at any time. The datacenter does not use either option, so you can only select one data center at a time.
datacenter variable
The query for this variable basically says, “Find all the data centers that exist.”
SHOW TAG VALUES WITH KEY = "datacenter"The values returned are America, Africa, Asia, and Europe.
host variable
The query for this variable basically says, “Find all hosts for the currently chosen data center.”
SHOW TAG VALUES WITH KEY = "hostname" WHERE "datacenter" =~ /^$datacenter$/If the user selects America, then the query changes to:
SHOW TAG VALUES WITH KEY = "hostname" WHERE "datacenter" =~ /^America/The query returns all servers associated with America, including server1, server2, and so on.
If the user selects Europe, then the query changes to:
SHOW TAG VALUES WITH KEY = "hostname" WHERE "datacenter" =~ /^Europe/The query returns all servers associated with Europe, including server3, server4, and so on.
More variables
Note
This example is theoretical. The InfluxDB server used in the example does not contain CPU metrics.
The dashboard stops at two levels, but you could keep going. For example, if you wanted to get CPU metrics for selected hosts, you could copy the host variable and extend the query so that it reads:
SHOW TAG VALUES WITH KEY = "cpu" WHERE "datacenter" =~ /^$datacenter$/ AND "host" =~ /^$host$/This query basically says, “Find the CPU metrics for the selected host.”
Depending on what variable options the user selects, you could get queries like:
SHOW TAG VALUES WITH KEY = "cpu" WHERE "datacenter" =~ /^America/ AND "host" =~ /^server2/
SHOW TAG VALUES WITH KEY = "cpu" WHERE "datacenter" =~ /^Africa/ AND "host" =~ /^server/7/
SHOW TAG VALUES WITH KEY = "cpu" WHERE "datacenter" =~ /^Europe/ AND "host" =~ /^server3+server4/
Best practices and tips
The following practices make your dashboards and variables easier to use.
New linked variables creation
- Chaining variables create parent/child dependencies. You can envision them as a ladder or a tree.
- The easiest way to create a new chained variable is to copy the variable that you want to base the new one on. In the variable list, click the Duplicate variable icon to the right of the variable entry to create a copy. You can then add on to the query for the parent variable.
- New variables created this way appear at the bottom of the list. You might need to drag it to a different position in the list to get it into a logical order.
Variable order
You can change the orders of variables in the dashboard variable list by clicking the up and down arrows on the right side of each entry. Grafana lists variable dropdowns left to right according to this list, with the variable at the top on the far left.
- List variables that do not have dependencies at the top, before their child variables.
- Each variable should follow the one it is dependent on.
- Remember there is no indication in the UI of which variables have dependency relationships. List the variables in a logical order to make it easy on other users (and yourself).
Complexity consideration
The more layers of dependency you have in variables, the longer it takes to update dashboards after you change variables.
For example, if you have a series of four linked variables (country, region, server, metric) and you change a root variable value (country), then Grafana must run queries for all the dependent variables before it updates the visualizations in the dashboard.
Filter variables with regular expressions
Using the Regex query option, you filter the list of options returned by the variable query or modify the options returned.
This page shows how to use a regular expression to filter/modify values in the variable dropdown.
Using the Regex query option, you filter the list of options returned by the Variable query or modify the options returned. For more information, refer to the Mozilla guide on Regular expressions.
Examples of filtering on the following list of options:
backend_01
backend_02
backend_03
backend_04
Filter so that only the options that end with 01 or 02 are returned:
Regex:
/(01|02)$/Result:
backend_01
backend_02
Filter and modify the options using a regular expression to capture group to return part of the text:
Regex:
/.*(01|02)/Result:
01
02
Filter and modify - Prometheus Example
List of options:
up{instance="demo.robustperception.io:9090",job="prometheus"} 1 1521630638000
up{instance="demo.robustperception.io:9093",job="alertmanager"} 1 1521630638000
up{instance="demo.robustperception.io:9100",job="node"} 1 1521630638000Regex:
/.*instance="([^"]*).*/Result:
demo.robustperception.io:9090
demo.robustperception.io:9093
demo.robustperception.io:9100
Filter and modify using named text and value capture groups
Using named capture groups, you can capture separate ’text’ and ‘value’ parts from the options returned by the variable query. This allows the variable drop-down list to contain a friendly name for each value that can be selected.
For example, when querying the node_hwmon_chip_names Prometheus metric, the chip_name is a lot friendlier than the chip value. So the following variable query result:
node_hwmon_chip_names{chip="0000:d7:00_0_0000:d8:00_0",chip_name="enp216s0f0np0"} 1
node_hwmon_chip_names{chip="0000:d7:00_0_0000:d8:00_1",chip_name="enp216s0f0np1"} 1
node_hwmon_chip_names{chip="0000:d7:00_0_0000:d8:00_2",chip_name="enp216s0f0np2"} 1
node_hwmon_chip_names{chip="0000:d7:00_0_0000:d8:00_3",chip_name="enp216s0f0np3"} 1
Passed through the following regular expression:
/chip_name="(?<text>[^"]+)|chip="(?<value>[^"]+)/gWould produce the following drop-down list:
Display Name          Value
------------          -------------------------
enp216s0f0np0         0000:d7:00_0_0000:d8:00_0
enp216s0f0np1         0000:d7:00_0_0000:d8:00_1
enp216s0f0np2         0000:d7:00_0_0000:d8:00_2
enp216s0f0np3         0000:d7:00_0_0000:d8:00_3
Note
Only
textandvaluecapture group names are supported.


