Configure the Google Cloud Monitoring data source
This document provides instructions for configuring the Google Cloud Monitoring data source in Grafana.
Before you begin
Before you begin, ensure you have the following:
- Grafana permissions: You must have the
Organization administratorrole to configure data sources. - GCP project: A Google Cloud Platform project.
- GCP permissions: Permissions to create a service account or configure GCE default service account settings in your GCP project.
Grafana includes built-in support for Google Cloud Monitoring, so you don’t need to install a plugin.
Set up GCP authentication
Before you can request data from Google Cloud Monitoring, you must configure authentication. All requests to Google APIs are performed on the server-side by the Grafana backend.
For authentication options and configuration details, refer to Google authentication.
When you configure Google authentication, note the following requirements specific to Google Cloud Monitoring.
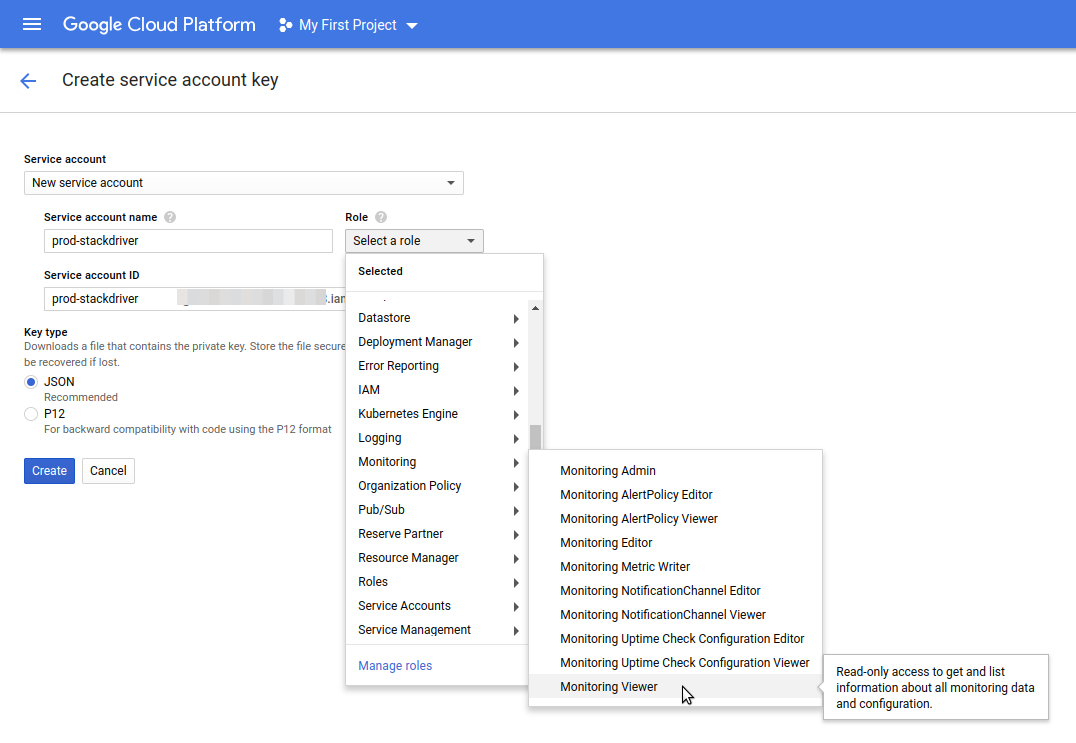
Configure a GCP Service Account
When you create a Google Cloud Platform (GCP) Service Account and key file, the Service Account must have the Monitoring Viewer role (Role > Select a role > Monitoring > Monitoring Viewer):

Grant the GCE Default Service Account scope
If Grafana is running on a Google Compute Engine (GCE) virtual machine, when you configure a GCE Default Service Account, you must also grant that Service Account access to the “Cloud Monitoring API” scope.
Enable Google Cloud Platform APIs
Before you can request data from Google Cloud Monitoring, you must enable the necessary APIs in your GCP project.
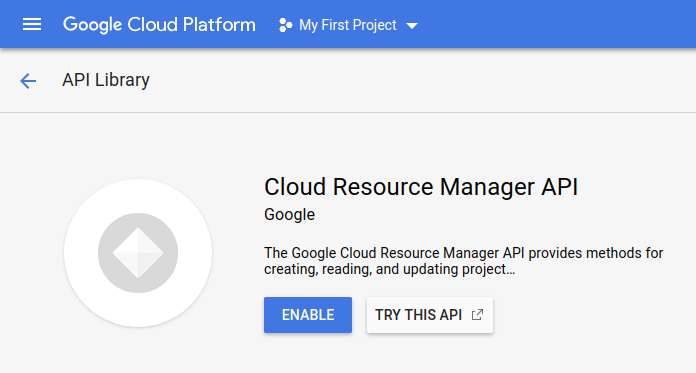
Open the Monitoring and Cloud Resource Manager API pages:
On each page, click Enable.
![Enable GCP APIs Enable GCP APIs]()
Enable GCP APIs
Add the data source
To add the Google Cloud Monitoring data source:
- Click Connections in the left-side menu.
- Click Add new connection.
- Enter
Google Cloud Monitoringin the search bar. - Select Google Cloud Monitoring.
- Click Add new data source in the upper right.
You’re taken to the Settings tab where you configure the data source.
Configure the data source in the UI
The following are configuration options for the Google Cloud Monitoring data source.
Authentication
Configure how Grafana authenticates with Google Cloud.
JWT Key Details
These settings appear when you select Google JWT File as the authentication type.
Service account impersonation
Use service account impersonation to have Grafana authenticate as a different service account than the one provided in the JWT token.
Private data source connect
Only available for Grafana Cloud.
Use private data source connect (PDC) to connect to and query data within a secure network without opening that network to inbound traffic from Grafana Cloud. For more information on how PDC works, refer to Private data source connect. For steps on setting up a PDC connection, refer to Configure Grafana private data source connect (PDC).
Save and test
Click Save & test to test the connection. A successful connection displays the following message:
Successfully queried the Google Cloud Monitoring API.
Provision the data source
You can define and configure the data source in YAML files as part of the Grafana provisioning system. For more information about provisioning, and for available configuration options, refer to Provisioning Grafana.
Provisioning examples
Using the JWT (Service Account key file) authentication type:
apiVersion: 1

datasources:
  - name: Google Cloud Monitoring
    type: stackdriver
    access: proxy
    jsonData:
      tokenUri: https://oauth2.googleapis.com/token
      clientEmail: stackdriver@myproject.iam.gserviceaccount.com
      authenticationType: jwt
      defaultProject: my-project-name
      universeDomain: googleapis.com
    secureJsonData:
      privateKey: |
        -----BEGIN PRIVATE KEY-----
        POSEvQIBADANBgkqhkiG9w0BAQEFAASCBKcwggSjAgEAAoIBAQCb1u1Srw8ICYHS
        ...
        yA+23427282348234=
        -----END PRIVATE KEY-----
Using the JWT (Service Account private key path) authentication type:
apiVersion: 1

datasources:
  - name: Google Cloud Monitoring
    type: stackdriver
    access: proxy
    jsonData:
      tokenUri: https://oauth2.googleapis.com/token
      clientEmail: stackdriver@myproject.iam.gserviceaccount.com
      authenticationType: jwt
      defaultProject: my-project-name
      universeDomain: googleapis.com
      privateKeyPath: /etc/secrets/gce.pem
Using GCE Default Service Account authentication:
apiVersion: 1

datasources:
  - name: Google Cloud Monitoring
    type: stackdriver
    access: proxy
    jsonData:
      authenticationType: gce
      universeDomain: googleapis.com
Provision the data source using Terraform
You can provision the Google Cloud Monitoring data source using Terraform with the Grafana Terraform provider.
For more information about provisioning resources with Terraform, refer to the Grafana as code using Terraform documentation.
Terraform prerequisites
Before you begin, ensure you have the following:
- Terraform installed.
- Grafana Terraform provider configured with appropriate credentials.
- For Grafana Cloud: A Cloud Access Policy token with data source permissions.
Provider configuration
Configure the Grafana provider to connect to your Grafana instance:
terraform {
  required_providers {
    grafana = {
      source  = "grafana/grafana"
      version = ">= 2.0.0"
    }
  }
}

# For Grafana Cloud
provider "grafana" {
  url  = "<YOUR_GRAFANA_CLOUD_STACK_URL>"
  auth = "<YOUR_SERVICE_ACCOUNT_TOKEN>"
}

# For self-hosted Grafana
# provider "grafana" {
#   url  = "http://localhost:3000"
#   auth = "<API_KEY_OR_SERVICE_ACCOUNT_TOKEN>"
# }
Terraform examples
The following examples show how to configure the Google Cloud Monitoring data source for each authentication method.
Using the JWT (Service Account key file) authentication type:
resource "grafana_data_source" "google_cloud_monitoring" {
  type = "stackdriver"
  name = "Google Cloud Monitoring"

  json_data_encoded = jsonencode({
    tokenUri           = "https://oauth2.googleapis.com/token"
    clientEmail        = "<SERVICE_ACCOUNT_EMAIL>"
    authenticationType = "jwt"
    defaultProject     = "<GCP_PROJECT_ID>"
    universeDomain     = "googleapis.com"
  })

  secure_json_data_encoded = jsonencode({
    privateKey = "<PRIVATE_KEY_CONTENT>"
  })
}
Using the JWT (Service Account private key path) authentication type:
resource "grafana_data_source" "google_cloud_monitoring" {
  type = "stackdriver"
  name = "Google Cloud Monitoring"

  json_data_encoded = jsonencode({
    tokenUri           = "https://oauth2.googleapis.com/token"
    clientEmail        = "<SERVICE_ACCOUNT_EMAIL>"
    authenticationType = "jwt"
    defaultProject     = "<GCP_PROJECT_ID>"
    universeDomain     = "googleapis.com"
    privateKeyPath     = "/etc/secrets/gce.pem"
  })
}
Using GCE Default Service Account authentication:
resource "grafana_data_source" "google_cloud_monitoring" {
  type = "stackdriver"
  name = "Google Cloud Monitoring"

  json_data_encoded = jsonencode({
    authenticationType = "gce"
    universeDomain     = "googleapis.com"
  })
}
For all available configuration options, refer to the Grafana provider data source resource documentation.
Next steps
After you configure the Google Cloud Monitoring data source, you can:
- Query GCP metrics using the visual Builder, MQL, SLO, or PromQL query types.
- Create template variables for dynamic, reusable dashboards.
- Add annotations to overlay GCP events on your graphs.
- Set up alerting to receive notifications based on GCP metrics and SLOs.
- Explore your data to investigate metrics without building a dashboard.
- Import pre-configured dashboards for popular GCP services.


