Investigate trends and spikes
Grafana Profiles Drilldown provides powerful tools that help you identify and analyze problems in your applications and services.
Using these steps, you can use the profile data to investigate issues.
With Grafana Play, you can explore and see how it works, learning from practical examples to accelerate your development. This feature can be seen on the Grafana Play site.
Explore your profile data
When you use Profiles Drilldown, your investigations follow these steps.
- Verify your data source in the Data source drop-down.
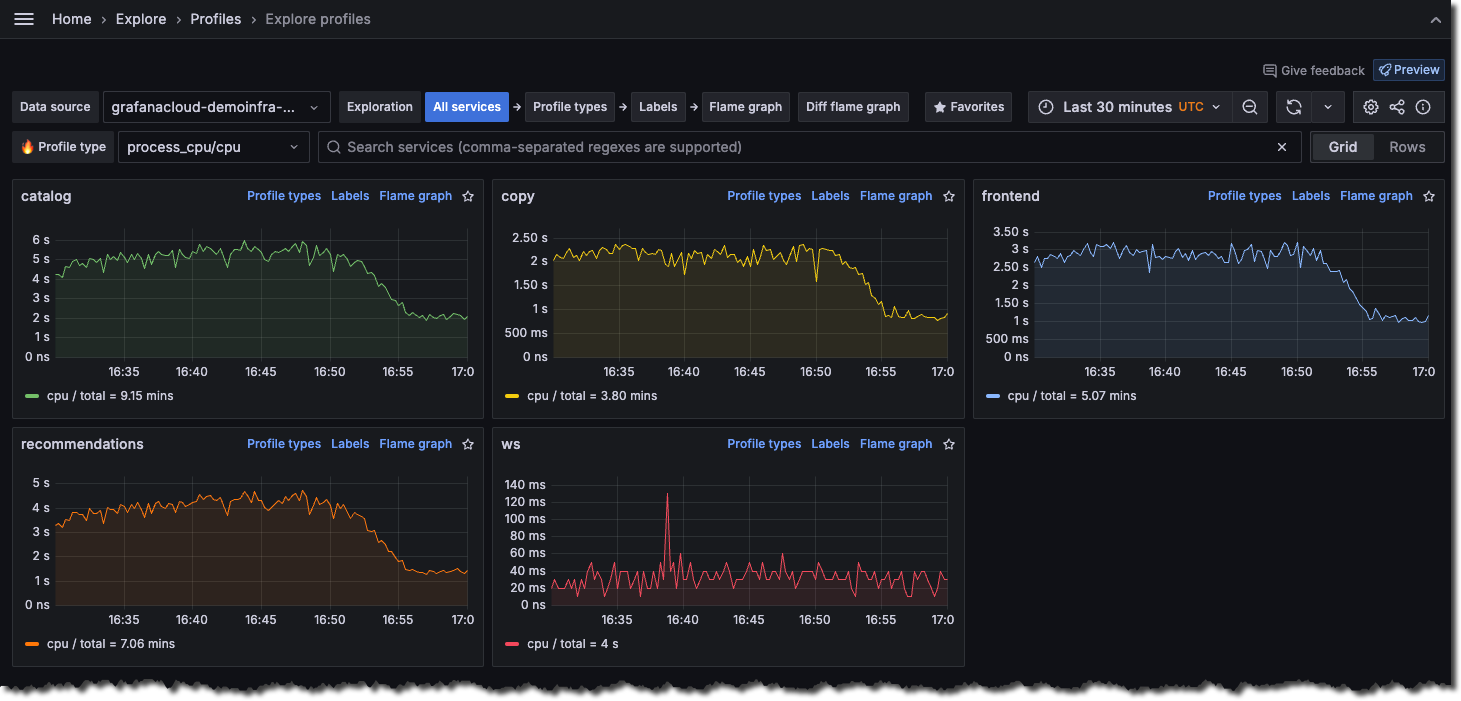
- Choose an Exploration type. All services is selected by default. Learn about the available views.
![The All services view]()
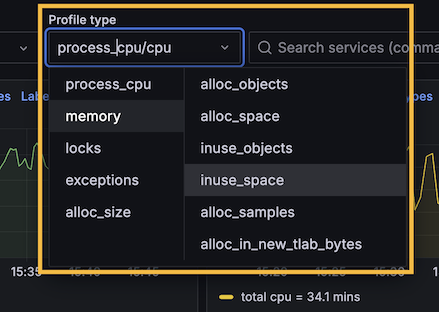
- Look for spikes or trends in the services to help identify issues. Use the Profiles drop-down to change profile types.
![Select a profile type]()
- After you identify the service to explore, you can change views:
- Select Profiles to review the profiles for a service.
- Select Labels to view the labels for a service. The Labels view helps you gain an understanding at an aggregated service level.
- Select Flame graph to view the flame graph for a service.
![Select an Exploration type to begin]()
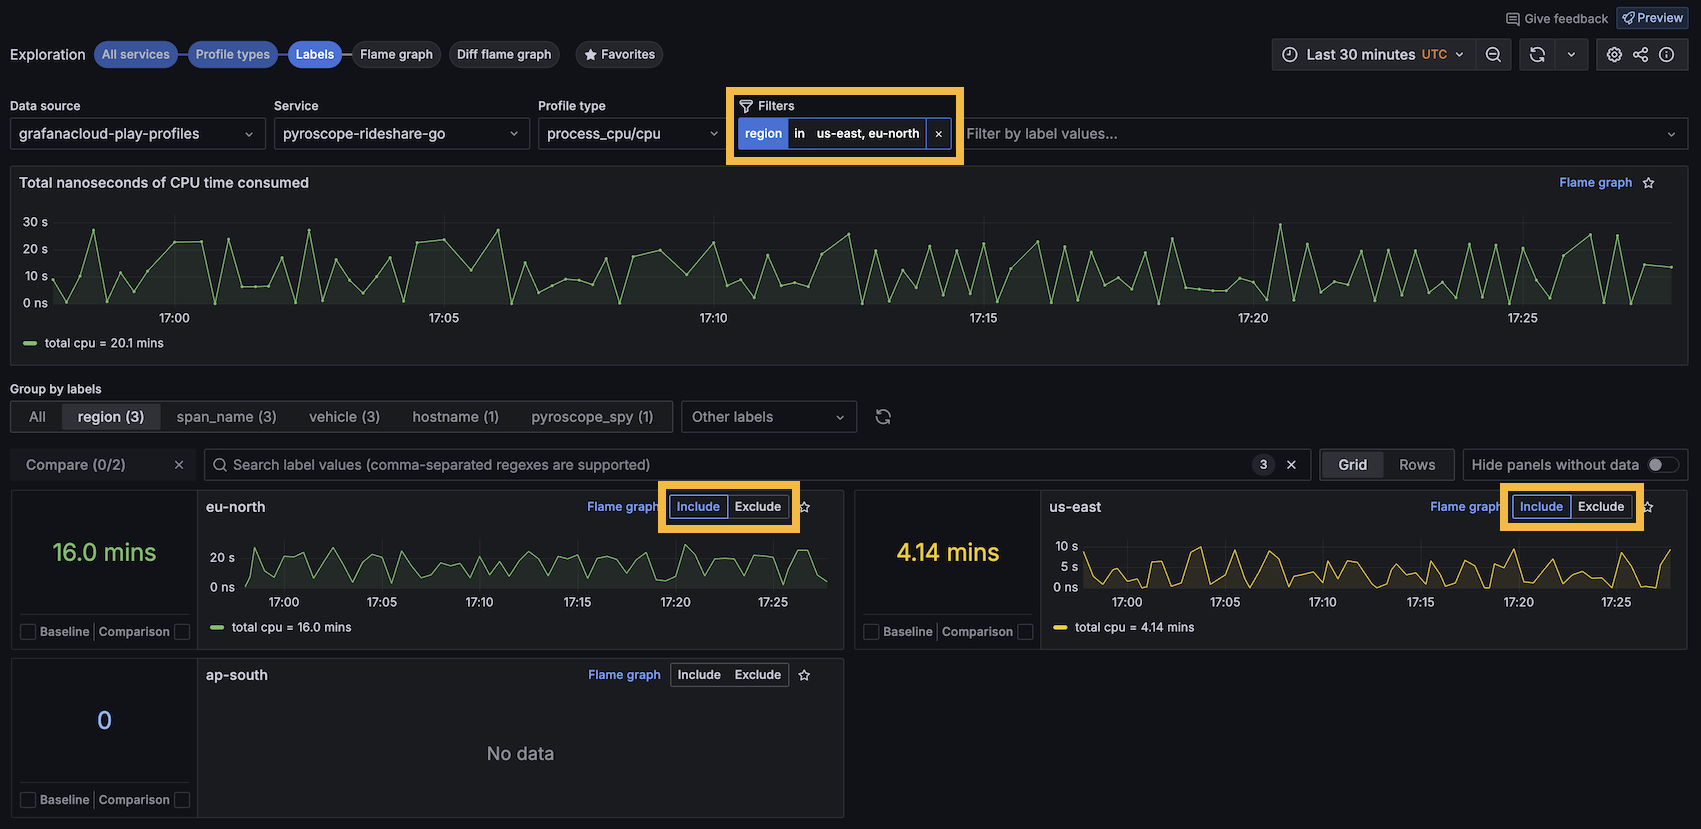
- Optional: Select filters to hone in on the problem areas. Each filter you select is added to the Filters statement at the top of the page. You can select filters in the following ways:
- Use the filter drop-downs in the Filters bar to add labels and operators. Once completed, the filter is automatically applied.
- From the Labels view: Select Include or Exclude from one of the areas of interest.
![Add filters]()
- Optional: Click and drag on any graph to select a specific time frame or data range.
- Use the Labels view to select two processes to compare.
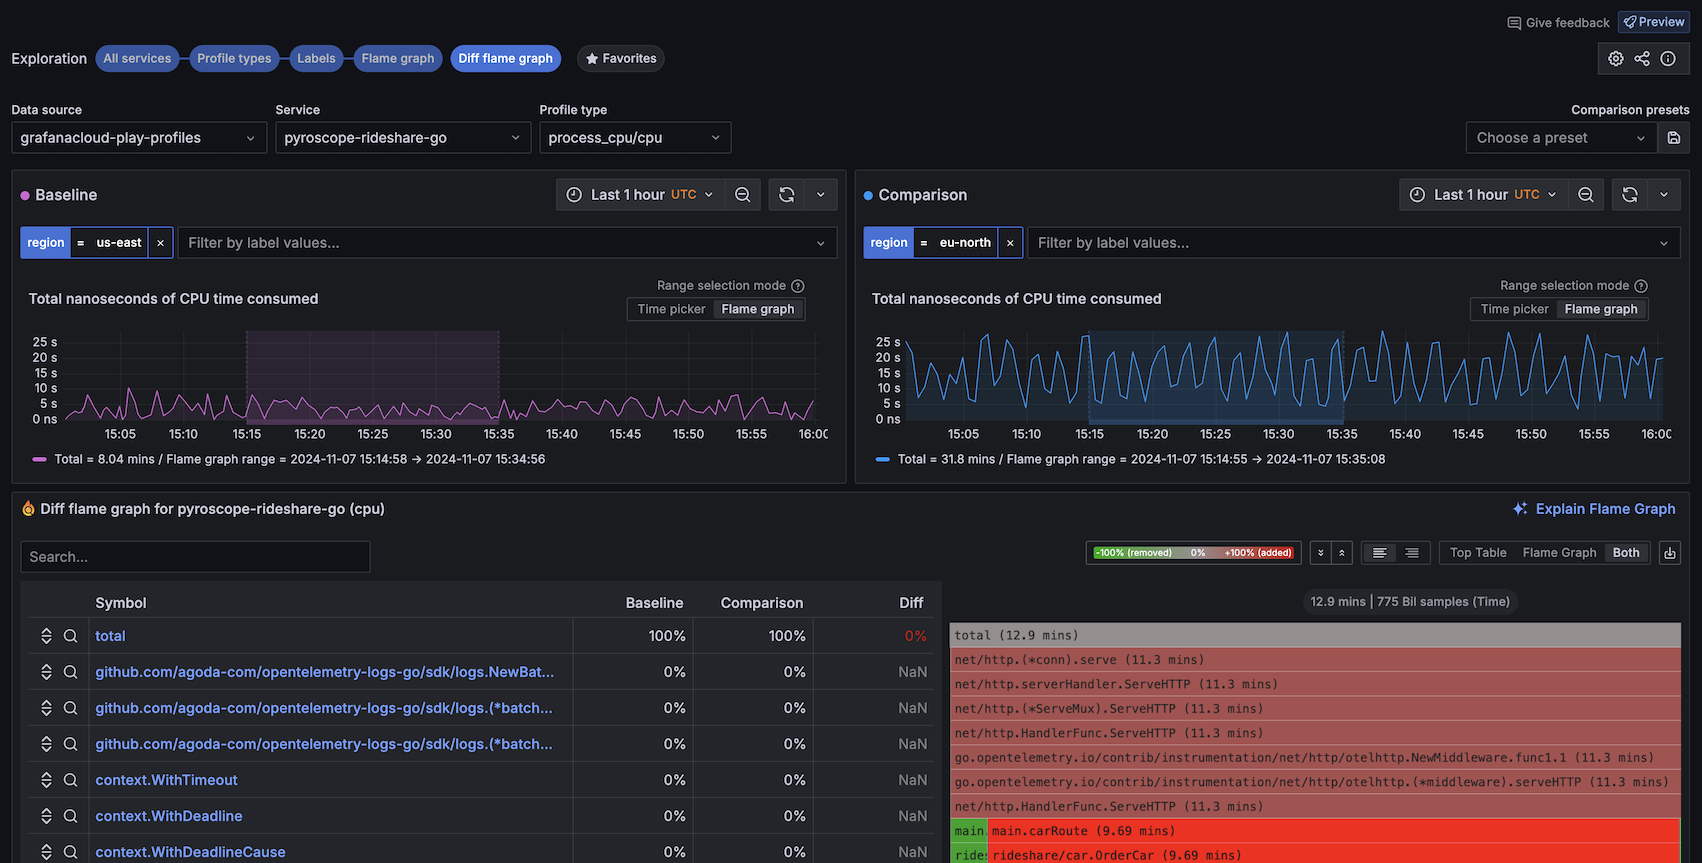
- Select both the Baseline and Comparison checkboxes. Select Compare to view your selections in the Diff flame graph view.
- Select both a time range in the baseline graph and in the comparison graph to view the diff flame graph.
![Labels view]()
- Use the Diff flame graph view to drill into the code level to pinpoint issues in specific functions, for example.
![Viewing a flame graph during an investigation]()


