
Panel editor
In the panel editor, you can update all the elements of a visualization including the data source, queries, time range, and visualization display options.
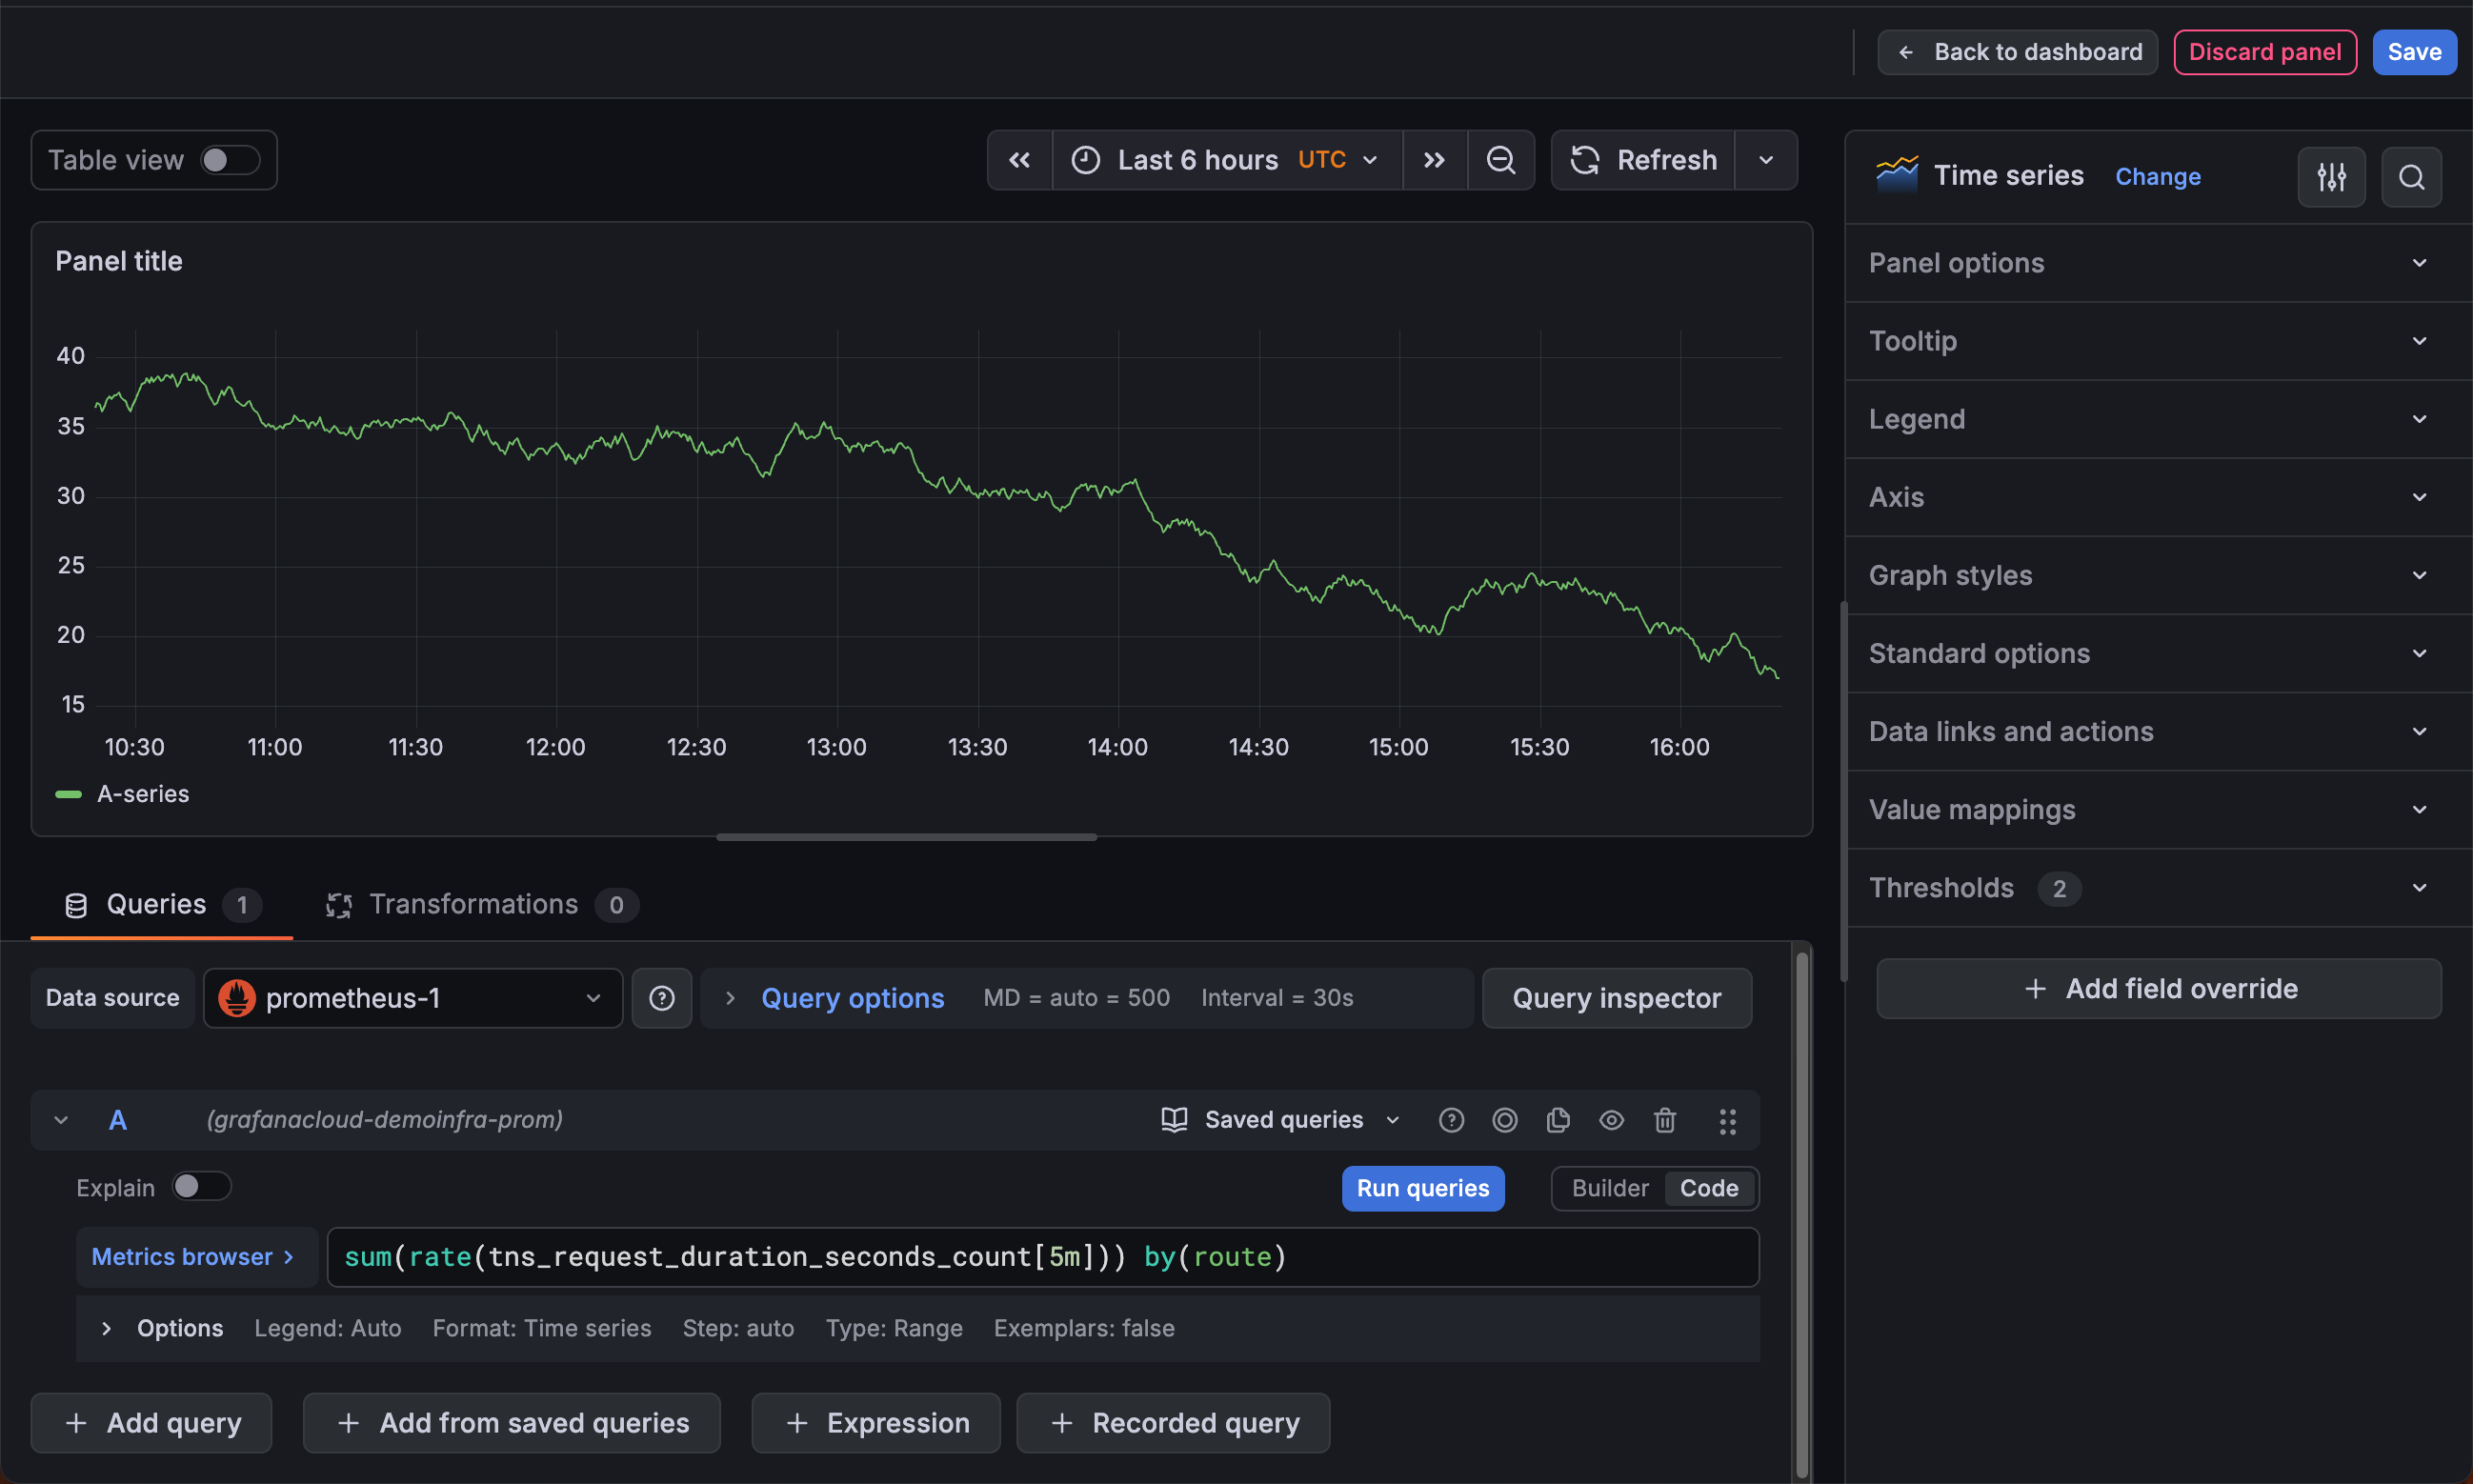
This following sections describe the areas of the Grafana panel editor.
Panel header
The header section lists the dashboard in which the panel appears and the following controls:
- Back to dashboard - Return to the dashboard with changes applied, but not yet saved.
- Discard panel changes - Discard changes you have made to the panel since you last saved the dashboard.
- Save dashboard - Save your changes to the dashboard.
Visualization preview
The visualization preview section contains the following options:
- Table view - Convert any visualization to a table so you can see the data. Table views are helpful for troubleshooting. This view only contains the raw data. It doesn’t include transformations you might have applied to the data or the formatting options available in the table visualization.
- Time range controls - Default is either the browser local timezone or the timezone selected at a higher level.
- Refresh - Query the data source.
Data section
The data section contains tabs where you enter queries, transform your data, and create alert rules (if applicable).
Queries
- Select your data source. You can also set or update the data source in existing dashboards using the drop-down menu in the Queries tab.
- Saved queries:
- Save query - To save the query for reuse, click the Save query button (or icon).
- Replace query - Reuse a saved query.
- + Add query - Add an additional query.
- + Add from saved queries - Add an additional query by reusing a saved query.
Note
Saved queries is currently in public preview in Grafana Enterprise and Grafana Cloud only.
Transformations - Apply data transformations. For more information, refer to Transform data.
Alert - Write alert rules. For more information, refer to the overview of Grafana Alerting.
Panel display options
The display options section contains tabs where you configure almost every aspect of your data visualization.


